| American Funds Growth Fund of Amer R6 RGAGX |
|
 |
|
| Release date as of 2024-03-31. Data on page is subject to change. |
|
|
| Style Box Details for Stock Holdings |
|
| Size |
|
| Average Mkt Cap $Mil |
162,765 |
|
|
|
| Market Capitalization |
% of Portfolio |
| Giant |
43.56 |
| Large |
33.75 |
| Medium |
20.21 |
| Small |
2.37 |
| Micro |
0.11 |
| |
|
|
| Investment Valuation |
Stock
Portfolio
|
| Forward P/E |
22.4 |
| Price/Book |
4.8 |
| Price/Sales |
2.8 |
| Price/Cash Flow |
13.8 |
| Dividend Yield |
0.9 |
| Long-Term Earnings |
13.3 |
| Historical Earnings |
17.0 |
| Sales Growth |
12.7 |
| Cash-Flow Growth |
14.9 |
| Book-Value Growth |
6.3 |
|
|
|
 |
|
| As of 2023-12-31 |
|
|
|
| % of Net Assets |
 |
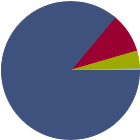
U.S. Stocks |
86.0 |
 |
Non-U.S. Stocks |
9.4 |
 |
Bonds |
0.0 |
 |
Cash |
4.1 |
 |
Other |
0.4 |
|
|
 |
| Data through 2023-12-31 |
|
|
|
| Morningstar Equity Sectors |
|
|
|
% of Stocks |
 |
Cyclical |
27.92 |
 |
Basic Materials |
2.42 |
 |
Consumer Cyclical |
16.77 |
 |
Financial Services |
8.64 |
 |
Real Estate |
0.09 |
|
|
|
 |
Sensitive |
55.52 |
 |
Communication Services |
12.50 |
 |
Energy |
3.40 |
 |
Industrials |
11.29 |
 |
Technology |
28.33 |
|
|
|
 |
Defensive |
16.57 |
 |
Consumer Defensive |
2.26 |
 |
Healthcare |
13.66 |
 |
Utilities |
0.65 |
|
| Data through 2023-12-31 |
|
|
|
|
| Total Number of Stock Holdings |
324 |
| Total Number of Bond Holdings |
0 |
| % of Net Assets in Top 10 Holdings |
30.85 |
|
|
| Turnover % |
(as of 2023-08-31) |
31.00 |
| 30 Day SEC Yield % |
0.60 |
|
|
Sector |
P/E |
% of Net
Assets
|
 |
|
|
|
|
 |
Microsoft Corp |
|
38.04 |
6.13 |
|
Meta Platforms Inc Class A |
|
32.66 |
4.58 |
 |
Capital Group Central Cash Fund |
--- |
--- |
4.15 |
|
Broadcom Inc |
|
49.25 |
3.50 |
|
Amazon.com Inc |
|
62.20 |
3.08 |
 |
|
Tesla Inc |
|
40.88 |
2.21 |
|
Alphabet Inc Class C |
|
26.25 |
1.88 |
|
UnitedHealth Group Inc |
|
20.73 |
1.85 |
|
Netflix Inc |
|
50.48 |
1.75 |
|
Eli Lilly and Co |
|
134.13 |
1.72 |
|
|
NVIDIA Corp |
|
75.74 |
1.68 |
|
Alphabet Inc Class A |
|
26.02 |
1.65 |
|
Mastercard Inc Class A |
|
40.71 |
1.64 |
|
General Electric Co |
|
22.00 |
1.46 |
|
Vertex Pharmaceuticals Inc |
|
30.09 |
1.21 |
|
|
Salesforce Inc |
|
71.71 |
1.18 |
|
TransDigm Group Inc |
|
52.25 |
1.15 |
|
Regeneron Pharmaceuticals Inc |
|
27.68 |
1.13 |
|
Uber Technologies Inc |
|
88.49 |
1.13 |
|
Royal Caribbean Group |
|
22.03 |
1.06 |
|
|
Carrier Global Corp Ordinary Shares |
|
36.79 |
1.03 |
|
Airbnb Inc Ordinary Shares - Class A |
|
22.78 |
1.02 |
|
Boeing Co |
|
--- |
0.97 |
|
ServiceNow Inc |
|
90.55 |
0.82 |
|
Visa Inc Class A |
|
32.15 |
0.80 |
|
|
 |
|
|

© Copyright 2024 Morningstar, Inc. All rights reserved. Morningstar, the Morningstar logo, Morningstar.com, Morningstar Tools are either trademark or service marks of Morningstar, Inc. The information contained herein: (1) is proprietary to Morningstar and/or its content providers; (2) may not be copied or distributed; and (3) is not warranted to be accurate, complete or timely. Neither Morningstar nor its content providers are responsible for any damages or any losses arising from any use of information. Past performance is no guarantee of future performance. |
|
Past performance is no guarantee of future results.
Returns will vary and shares may be worth more or less than their original cost when sold.
|
|

