| Dodge & Cox Stock I DODGX |
|
 |
|
| Release date as of 2024-03-31. Data on page is subject to change. |
|
|
Overall Morningstar
Rating™
|
| What is this?
|
|
 |
| As of 2024-03-31 |
|
Out of 1118
Large Value Funds
|
|
|
|
|
|
| Total Fund Assets ($ Mil) |
| 109,906.85 |
|
|
|
| Investment Objective & Strategy |
|
| The investment seeks long-term growth of principal and income; a secondary objective is to achieve a reasonable current income.
|
|
| The fund invests primarily in a diversified portfolio of equity securities. It will invest at least 80% of its total assets in equity securities, including common stocks, depositary receipts evidencing ownership of common stocks, certain preferred stocks, securities convertible into common stocks, and securities that carry the right to buy common stocks. The fund may invest up to 20% of its total assets in U.S. dollar-denominated securities of non-U.S. issuers traded in the United States that are not in the S&P 500 Index. |
|
|
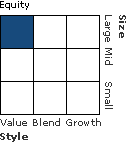
| Morningstar Category: Large Value |
|
| Large-value portfolios invest primarily in big U.S. companies that are less expensive or growing more slowly than other large-cap stocks. Stocks in the top 70% of the capitalization of the U.S. equity market are defined as large cap. Value is defined based on low valuations (low price ratios and high dividend yields) and slow growth (low growth rates for earnings, sales, book value, and cash flow).
|
|
|
| Growth of $10,000 |
|
(from 2014-01-01
to 2024-03-31)
|
|
|
|
|
 |
Investment: |
Dodge & Cox Stock I |
 |
Benchmark 1: |
S&P 500 TR USD |
 |
Benchmark 2: |
Russell 1000 Value TR USD |
 |
Category: |
Large Value |
|
|
This graph presents historical performance for the investment as well as an index and/or peer group. If the investment, index and/or peer group have performed similarly, the line representing the fund will overlay the index and/or peer group. Therefore, the line(s) representing the index and/or peer group history may be hidden.
|
|
|
| Total Annualized Returns % |
|
|
YTD |
1 Year |
3 Year |
5 Year |
10 Year |
Since Inception |
| Investment |
8.50 |
25.59 |
10.37 |
13.57 |
11.08 |
11.24 |
| S&P 500 TR USD |
10.56 |
29.88 |
11.49 |
15.05 |
12.96 |
--- |
| Russell 1000 Value TR USD |
8.99 |
20.27 |
8.11 |
10.32 |
9.01 |
--- |
| Category |
8.83 |
20.70 |
8.87 |
10.89 |
9.09 |
9.76 |
|
|
|
| Morningstar Rating |
--- |
--- |
 |
|
|
--- |
|
|
# of compared
Large Value
funds covered
(3 yrs : out of
1118
funds)
(5 yrs : out of
1058
funds)
(10 yrs : out of
816
funds)
|
|
|
|
| Ratings reflect risk-adjusted performance and are derived from a weighted average of the performance figures associated with its three, five and ten-year (if applicable) time periods. |
|
|
|
|
|
| Investment results shown represent historical performance and do not guarantee future results. Investment returns and principal values fluctuate with changes in interest rates and other market conditions so the value, when redeemed may be worth more or less than original costs. Current performance may be lower or higher than the performance data shown. |
|
|
|
Total Annual Operating Expense
|
0.51%
|
| Prospectus Net Expense Ratio |
0.51%
|
| Maximum Sales Charge |
--- |
|
| The total annual operating expense shown is before management fee waivers or expense caps. For more information on waivers/reimbursements, please see the prospectus. The total annual operating expense is also referred to as the prospectus gross expense ratio. |
|
|
Type |
Date |
% |
| --- |
--- |
--- |
--- |
|
|
| % of Net Assets |
 |
U.S. Stocks |
89.5 |
 |
Non-U.S. Stocks |
9.9 |
 |
Bonds |
0.1 |
 |
Cash |
0.6 |
 |
Other |
0.0 |
|
|
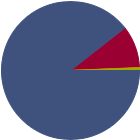 |
| Data through 2024-03-31 |
|
|
|
|
| Morningstar Equity Sectors |
|
|
|
% of Stocks |
 |
Cyclical |
31.42 |
 |
Basic Materials |
3.75 |
 |
Consumer Cyclical |
4.82 |
 |
Financial Services |
22.20 |
 |
Real Estate |
0.65 |
|
|
|
 |
Sensitive |
42.48 |
 |
Communication Services |
11.04 |
 |
Energy |
6.24 |
 |
Industrials |
11.21 |
 |
Technology |
13.99 |
|
|
|
 |
Defensive |
26.11 |
 |
Consumer Defensive |
1.97 |
 |
Healthcare |
22.83 |
 |
Utilities |
1.31 |
|
| Data through 2024-03-31 |
|
|
| Total Number of Stock Holdings |
79 |
| Total Number of Bond Holdings |
0 |
| % of Net Assets in Top 10 Holdings |
30.73 |
|
|
| Turnover % |
(as of 2023-12-31) |
12.00 |
| 30 Day SEC Yield % |
1.45 |
|
|
Sector |
P/E |
% of Net
Assets
|
 |
|
|
|
|
|
Wells Fargo & Co |
|
12.00 |
4.30 |
|
Charles Schwab Corp |
|
28.48 |
3.82 |
|
Fiserv Inc |
|
32.09 |
3.39 |
|
Occidental Petroleum Corp |
|
16.66 |
3.22 |
|
The Cigna Group |
|
20.88 |
3.06 |
 |
 |
MetLife Inc |
|
40.94 |
2.75 |
|
RTX Corp |
|
43.74 |
2.71 |
|
Sanofi SA ADR |
|
--- |
2.58 |
|
Alphabet Inc Class C |
|
26.25 |
2.53 |
 |
Microsoft Corp |
|
38.04 |
2.37 |
|
|
 |
|
|
|
|
|
| Loss of Money, Not FDIC Insured, Market/Market Volatility, Equity Securities, Restricted/Illiquid Securities, Derivatives, Management |
|
| Show Risk Definitions |
|
|
| Inception Date: 1965-01-04 |
|
| Steven C. Voorhis (2006-05-01) |
|
| Mr. Voorhis received his B.A. and M.A. degrees from Stanford University in 1992 and his M.B.A from the Harvard Business School in 1996. Prior to graduate school, he worked at Goldman Sachs as a financial analyst. He joined Dodge & Cox in 1996. Mr. Voorhis is a shareholder of the firm and a CFA charterholder. |
|
| Karol Marcin (2018-01-31) |
|
| Mr. Marcin is Vice President of Dodge & Cox; Research Analyst and member of Dodge & Cox’s U.S. Equity Investment Committee (since 2018) and Dodge & Cox’s Global Equity Investment Committee. He received his B.A. (summa cum laude) from Whitman College in 1995 and his M.B.A. from the Stanford Graduate School of Business in 2000. Prior to entering graduate school, he worked for three years as a financial analyst with Salomon Brothers. Mr. Marcin joined Dodge & Cox in 2000. Mr. Marcin is a shareholder of the firm and a CFA charterholder. |
|
| Philippe Barret (2013-02-28) |
|
| Philippe Barret, Jr. is Vice President who was Research Analyst.. Mr. Barret received his B.A. degree (magna cum laude) from Washington and Lee University in 1998 and his M.B.A. degree from the Stanford Graduate School of Business in 2004. Between degrees, he worked as financial analyst at JP Morgan and American Securities Capital Partners, LLC. Mr. Barret joined Dodge & Cox in 2004. He is a shareholder of the firm and holds the CFA® designation. |
|
| Kathleen G. McCarthy (2016-01-31) |
|
| Ms. McCarthy is Vice President of Dodge & Cox, who was Research Analyst and member of Dodge & Cox’s U.S. Equity Investment Committee received her B.A. degree in Economics from Stanford University in 2001 and her M.B.A. degree from the Stanford Graduate School of Business in 2007. Prior to graduate school, she worked at Merrill Lynch and Palladium Equity Partners. Ms. McCarthy joined Dodge & Cox in 2007 and is a shareholder of the firm and a CFA charterholder. |
|
| Benjamin V. Garosi (2019-01-31) |
|
| Mr. Garosi received his B.A. degree (Phi Beta Kappa) in Economics from the University of California, Berkeley in 2002 and his M.B.A. degree from the Harvard Business School in 2009. Prior to graduate school, he worked as a private equity associate at Blum Capital Partners and as an analyst in investment banking at Goldman Sachs. Mr. Garosi joined Dodge & Cox in 2009. Mr. Garosi is a CFA charterholder. |
|
| Karim A Fakhry (2021-05-01) |
|
| David C. Hoeft (2002-01-01) |
|
| He is Vice President. He was Senior Vice President and Director of Dodge & Cox; Chief Investment Officer (since 2022), Associate Director of Research (until 2019), and member of USEIC, GEIC, and BIC (since May 2022) after joining Dodge & Cox in 1993. He is a Director and shareholder of the firm and a CFA charterholder. Prior to entering graduate school, he worked for two years as a consultant to the energy industry. Mr. Hoeft received his B.A. degree (Phi Beta Kappa) from the University of Chicago in 1989 and his M.B.A. from the Harvard Business School in 1993. |
|
|
|
|
|
|
|
|
|

© Copyright 2024 Morningstar, Inc. All rights reserved. Morningstar, the Morningstar logo, Morningstar.com, Morningstar Tools are either trademark or service marks of Morningstar, Inc. The information contained herein: (1) is proprietary to Morningstar and/or its content providers; (2) may not be copied or distributed; and (3) is not warranted to be accurate, complete or timely. Neither Morningstar nor its content providers are responsible for any damages or any losses arising from any use of information. Past performance is no guarantee of future performance. |
|
Past performance is no guarantee of future results.
Returns will vary and shares may be worth more or less than their original cost when sold.
|
|