| Oakmark International Small Cap Investor OAKEX |
|
 |
|
| Release date as of 2024-03-31. Data on page is subject to change. |
|
|
Overall Morningstar
Rating™
|
| What is this?
|
|
 |
| As of 2024-03-31 |
|
Out of 46
Foreign Small/Mid Value Funds
|
|
|
|
|
|
| Total Fund Assets ($ Mil) |
| 1,462.22 |
|
|
|
| Investment Objective & Strategy |
|
| The investment seeks long-term capital appreciation.
|
|
| The fund invests primarily in a diversified portfolio of common stocks of non-U.S. companies. It invests at least 80% of its net assets (plus any borrowings for investment purposes) in the stocks of "small cap companies." A small cap company is one whose market capitalization is no greater than the largest market capitalization of any company included in the S&P EPAC (Europe Pacific Asia Composite) Small Cap Index. The fund may invest in non-U.S. markets throughout the world, including emerging markets. It will invest in the securities of at least five countries outside the U.S. |
|
|
| Morningstar Category: Foreign Small/Mid Value |
|
| Foreign small/mid-value portfolios invest in international stocks that are smaller and less expensive than other stocks. These portfolios primarily invest in stocks that fall in the bottom 30% of each economically integrated market (such as Europe or Asia ex-Japan). Value is defined based on low valuations (low price ratios and high dividend yields) and slow growth (low growth rates for earnings, sales, book value, and cash flow). These portfolios typically will have less than 20% of assets invested in U.S. stocks.
|
|
|
| Growth of $10,000 |
|
(from 2014-01-01
to 2024-03-31)
|
|
|
|
|
 |
Investment: |
Oakmark International Small Cap Investor |
 |
Benchmark 1: |
MSCI ACWI Ex USA NR USD |
 |
Benchmark 2: |
MSCI ACWI ex USA SMID Value NR USD |
 |
Category: |
Foreign Small/Mid Value |
|
|
This graph presents historical performance for the investment as well as an index and/or peer group. If the investment, index and/or peer group have performed similarly, the line representing the fund will overlay the index and/or peer group. Therefore, the line(s) representing the index and/or peer group history may be hidden.
|
|
|
| Total Annualized Returns % |
|
|
YTD |
1 Year |
3 Year |
5 Year |
10 Year |
Since Inception |
| Investment |
0.51 |
12.74 |
3.15 |
8.45 |
4.65 |
8.62 |
| MSCI ACWI Ex USA NR USD |
4.69 |
13.26 |
1.94 |
5.97 |
4.25 |
--- |
| MSCI ACWI ex USA SMID Value NR USD |
2.21 |
14.07 |
2.54 |
5.22 |
3.90 |
6.56 |
| Category |
3.43 |
14.51 |
4.46 |
6.79 |
4.38 |
7.20 |
|
|
|
| Morningstar Rating |
--- |
--- |
 |
|
 |
--- |
|
|
# of compared
Foreign Small/Mid Value
funds covered
(3 yrs : out of
46
funds)
(5 yrs : out of
40
funds)
(10 yrs : out of
22
funds)
|
|
|
|
| Ratings reflect risk-adjusted performance and are derived from a weighted average of the performance figures associated with its three, five and ten-year (if applicable) time periods. |
|
|
|
|
|
| Investment results shown represent historical performance and do not guarantee future results. Investment returns and principal values fluctuate with changes in interest rates and other market conditions so the value, when redeemed may be worth more or less than original costs. Current performance may be lower or higher than the performance data shown. |
|
|
|
Total Annual Operating Expense
|
1.34%
|
| Prospectus Net Expense Ratio |
1.34%
|
| Maximum Sales Charge |
--- |
|
| The total annual operating expense shown is before management fee waivers or expense caps. For more information on waivers/reimbursements, please see the prospectus. The total annual operating expense is also referred to as the prospectus gross expense ratio. |
|
|
Type |
Date |
% |
| --- |
--- |
--- |
--- |
|
|
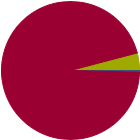
| % of Net Assets |
 |
U.S. Stocks |
0.4 |
 |
Non-U.S. Stocks |
95.6 |
 |
Bonds |
0.0 |
 |
Cash |
4.1 |
 |
Other |
0.0 |
|
|
 |
| Data through 2024-03-31 |
|
|
|
|
| Morningstar Equity Sectors |
|
|
|
% of Stocks |
 |
Cyclical |
38.48 |
 |
Basic Materials |
3.02 |
 |
Consumer Cyclical |
15.66 |
 |
Financial Services |
17.14 |
 |
Real Estate |
2.66 |
|
|
|
 |
Sensitive |
50.20 |
 |
Communication Services |
6.31 |
 |
Energy |
0.00 |
 |
Industrials |
32.26 |
 |
Technology |
11.63 |
|
|
|
 |
Defensive |
11.31 |
 |
Consumer Defensive |
1.78 |
 |
Healthcare |
9.53 |
 |
Utilities |
0.00 |
|
| Data through 2024-03-31 |
|
|
|
| Morningstar World Regions |
|
| % Fund |
| Americas |
5.9 |
|
| North America |
2.7 |
| Latin America |
3.2 |
|
| Greater Europe |
76.0 |
|
| United Kingdom |
20.9 |
| Europe Developed |
53.6 |
| Europe Emerging |
0.0 |
| Africa/Middle East |
1.5 |
|
| Greater Asia |
18.1 |
|
| Japan |
5.8 |
| Australasia |
4.2 |
| Asia Developed |
7.3 |
| Asia Emerging |
0.9 |
|
| Data through 2024-03-31 |
|
|
| Total Number of Stock Holdings |
63 |
| Total Number of Bond Holdings |
0 |
| % of Net Assets in Top 10 Holdings |
27.82 |
|
|
| Turnover % |
(as of 2023-09-30) |
32.00 |
| 30 Day SEC Yield % |
3.21 |
|
|
Sector |
Country |
% of Net
Assets
|
 |
|
|
|
|
 |
Duerr AG |
|
Germany |
3.16 |
|
Julius Baer Gruppe AG |
|
Switzerland |
3.16 |
|
ISS A/S |
|
Denmark |
3.13 |
|
Atea ASA |
|
Norway |
2.77 |
 |
DS Smith PLC |
|
United Kingdom |
2.71 |
 |
|
Azimut Holding SPA |
|
Italy |
2.71 |
|
Dometic Group AB |
|
Sweden |
2.61 |
|
BNK Financial Group Inc |
|
South Korea |
2.56 |
|
Loomis AB Class B |
|
Sweden |
2.52 |
|
Hays PLC |
|
United Kingdom |
2.49 |
|
|
 |
|
|
|
|
|
| Emerging Markets, Foreign Securities, Long-Term Outlook and Projections, Loss of Money, Not FDIC Insured, Country or Region, Capitalization, Value Investing, Market/Market Volatility, Equity Securities, Restricted/Illiquid Securities, Portfolio Diversification, Small Cap |
|
| Show Risk Definitions |
|
|
| Inception Date: 1995-11-01 |
|
| Michael L. Manelli (2011-05-11) |
|
| - Vice President of The Oakmark Funds
- Portfolio Manager of the Oakmark International Fund and the Oakmark International Small Cap Fund
- Portfolio Manager of International and International Small Cap Strategies
- BBA (University of Iowa, 2000)
- Research Associate/Analyst at Morgan Stanley (2001-05) |
|
| Justin D Hance (2016-11-30) |
|
| - Vice President of The Oakmark Funds
- Portfolio Manager of the Oakmark International Small Cap Fund
- Portfolio Manager of International Small Cap Strategy
- BA (Claremont McKenna College, 2006)
- Senior International Investment Analyst with Harris Associates (2010-14); Investment Analyst at BMGI (2006-10) |
|
| David G. Herro (1995-11-01) |
|
| - Vice President of The Oakmark Funds
- Portfolio Manager of the Oakmark International Fund, the Oakmark International Small Cap Fund, the Oakmark Global Fund and the Oakmark Global Select Fund
- Portfolio Manager of the International, International Small Cap, Japan, Global All Cap, Global and Global Concentrated Strategies
- BS (University of Wisconsin-Platteville, 1983)
- MA (University of Wisconsin-Milwaukee, 1985)
- Portfolio Manager specializing in developing and managing international portfolios for the State of Wisconsin Investment Board (1989-92), and The Principal Financial Group (1986-89) |
|
|
|
|
|
|
|
|
|

© Copyright 2024 Morningstar, Inc. All rights reserved. Morningstar, the Morningstar logo, Morningstar.com, Morningstar Tools are either trademark or service marks of Morningstar, Inc. The information contained herein: (1) is proprietary to Morningstar and/or its content providers; (2) may not be copied or distributed; and (3) is not warranted to be accurate, complete or timely. Neither Morningstar nor its content providers are responsible for any damages or any losses arising from any use of information. Past performance is no guarantee of future performance. |
|
Past performance is no guarantee of future results.
Returns will vary and shares may be worth more or less than their original cost when sold.
|
|