| Harding Loevner Emerging Markets Advisor HLEMX |
|
 |
|
| Release date as of 2024-03-31. Data on page is subject to change. |
|
|
Overall Morningstar
Rating™
|
| What is this?
|
|
 |
| As of 2024-03-31 |
|
Out of 721
Diversified Emerging Mkts Funds
|
|
|
|
|
|
| Total Fund Assets ($ Mil) |
| 946.52 |
|
|
|
| Investment Objective & Strategy |
|
| The investment seeks long-term capital appreciation through investments in equity securities of companies based in emerging markets.
|
|
| The Portfolio invests at least 80% of its net assets in emerging markets securities, which includes frontier markets securities, and investment companies. It invests at least 65% of its total assets in common stocks, preferred stocks, rights and warrants issued by companies that are based in emerging or frontier markets, securities convertible into such securities (including Depositary Receipts), and investment companies that invest in the types of securities in which the Portfolio would normally invest. |
|
|
| Morningstar Category: Diversified Emerging Mkts |
|
| Diversified emerging-markets portfolios tend to divide their assets among 20 or more nations, although they tend to focus on the emerging markets of Asia and Latin America rather than on those of the Middle East, Africa, or Europe. These portfolios invest predominantly in emerging market equities, but some funds also invest in both equities and fixed income investments from emerging markets.
|
|
|
| Growth of $10,000 |
|
(from 2014-01-01
to 2024-03-31)
|
|
|
|
|
 |
Investment: |
Harding Loevner Emerging Markets Advisor |
 |
Benchmark 1: |
MSCI ACWI Ex USA NR USD |
 |
Benchmark 2: |
MSCI EM NR USD |
 |
Category: |
Diversified Emerging Mkts |
|
|
This graph presents historical performance for the investment as well as an index and/or peer group. If the investment, index and/or peer group have performed similarly, the line representing the fund will overlay the index and/or peer group. Therefore, the line(s) representing the index and/or peer group history may be hidden.
|
|
|
| Total Annualized Returns % |
|
|
YTD |
1 Year |
3 Year |
5 Year |
10 Year |
Since Inception |
| Investment |
-0.29 |
2.99 |
-9.91 |
-1.51 |
1.09 |
8.42 |
| MSCI ACWI Ex USA NR USD |
4.69 |
13.26 |
1.94 |
5.97 |
4.25 |
--- |
| MSCI EM NR USD |
2.37 |
8.15 |
-5.05 |
2.22 |
2.95 |
--- |
| Category |
2.70 |
10.31 |
-3.83 |
3.23 |
2.96 |
7.09 |
|
|
|
| Morningstar Rating |
--- |
--- |
 |
|
|
--- |
|
|
# of compared
Diversified Emerging Mkts
funds covered
(3 yrs : out of
721
funds)
(5 yrs : out of
657
funds)
(10 yrs : out of
425
funds)
|
|
|
|
| Ratings reflect risk-adjusted performance and are derived from a weighted average of the performance figures associated with its three, five and ten-year (if applicable) time periods. |
|
|
|
|
|
| Investment results shown represent historical performance and do not guarantee future results. Investment returns and principal values fluctuate with changes in interest rates and other market conditions so the value, when redeemed may be worth more or less than original costs. Current performance may be lower or higher than the performance data shown. |
|
|
|
Total Annual Operating Expense
|
1.20%
|
| Prospectus Net Expense Ratio |
1.20%
|
| Maximum Sales Charge |
--- |
|
| The total annual operating expense shown is before management fee waivers or expense caps. For more information on waivers/reimbursements, please see the prospectus. The total annual operating expense is also referred to as the prospectus gross expense ratio. |
|
|
Type |
Date |
% |
| --- |
--- |
--- |
--- |
|
|
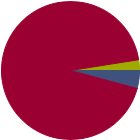
| % of Net Assets |
 |
U.S. Stocks |
4.2 |
 |
Non-U.S. Stocks |
93.4 |
 |
Bonds |
0.0 |
 |
Cash |
2.5 |
 |
Other |
0.0 |
|
|
 |
| Data through 2023-12-31 |
|
|
|
|
| Morningstar Equity Sectors |
|
|
|
% of Stocks |
 |
Cyclical |
42.44 |
 |
Basic Materials |
0.97 |
 |
Consumer Cyclical |
16.18 |
 |
Financial Services |
24.21 |
 |
Real Estate |
1.08 |
|
|
|
 |
Sensitive |
47.54 |
 |
Communication Services |
6.52 |
 |
Energy |
2.12 |
 |
Industrials |
12.14 |
 |
Technology |
26.76 |
|
|
|
 |
Defensive |
10.03 |
 |
Consumer Defensive |
6.36 |
 |
Healthcare |
3.03 |
 |
Utilities |
0.64 |
|
| Data through 2023-12-31 |
|
|
|
| Morningstar World Regions |
|
| % Fund |
| Americas |
19.0 |
|
| North America |
4.3 |
| Latin America |
14.7 |
|
| Greater Europe |
10.6 |
|
| United Kingdom |
0.4 |
| Europe Developed |
3.2 |
| Europe Emerging |
1.9 |
| Africa/Middle East |
5.1 |
|
| Greater Asia |
70.4 |
|
| Japan |
0.0 |
| Australasia |
0.0 |
| Asia Developed |
26.4 |
| Asia Emerging |
44.1 |
|
| Data through 2023-12-31 |
|
|
| Total Number of Stock Holdings |
76 |
| Total Number of Bond Holdings |
0 |
| % of Net Assets in Top 10 Holdings |
34.35 |
|
|
| Turnover % |
(as of 2023-10-31) |
31.00 |
| 30 Day SEC Yield % |
--- |
|
|
Sector |
Country |
% of Net
Assets
|
 |
|
|
|
|
 |
Samsung Electronics Co Ltd DR |
|
South Korea |
5.56 |
|
Taiwan Semiconductor Manufacturing Co Ltd |
|
Taiwan |
5.49 |
|
HDFC Bank Ltd |
|
India |
4.95 |
|
Tencent Holdings Ltd |
|
China |
3.43 |
|
Tata Consultancy Services Ltd |
|
India |
3.34 |
 |
|
Fomento Economico Mexicano SAB de CV ADR |
|
Mexico |
2.47 |
|
Maruti Suzuki India Ltd |
|
India |
2.46 |
 |
Northern Institutional Treasury Premier |
--- |
United States |
2.30 |
|
Grupo Financiero Banorte SAB de CV Class O |
|
Mexico |
2.26 |
|
Eclat Textile Co Ltd |
|
Taiwan |
2.09 |
|
|
 |
|
|
|
|
|
| Currency, Emerging Markets, Foreign Securities, Loss of Money, Not FDIC Insured, Market/Market Volatility, Depositary Receipts, China Region, Financials Sector |
|
| Show Risk Definitions |
|
|
| Inception Date: 1998-11-09 |
|
| Scott Crawshaw (2014-06-30) |
|
| Scott Crawshaw is a member of the PM team for the Emerging Markets Equity, International Equity & Global Equity strategies. He is also an Emerging Markets analyst. Scott joined the firm in 2014 & is a Partner. He has 22 yrs of experience in EM research & portfolio management, including 5 yrs at ISIS Asset Management where he served as an Emerging Markets Fund Manager until 2003. Prior to joining Harding Loevner, Scott served as an Emerging Markets Senior Portfolio Manager at Russell Investments. He graduated from The University of Bristol (1995) with a BSc in Mathematics. |
|
| Pradipta Chakrabortty (2015-01-31) |
|
| Pradipta Chakrabortty has been a portfolio manager and an analyst since 2008. As an analyst, he focuses on frontier emerging market companies. Mr. Chakrabortty graduated from BIRLA Institute of Technology & Science (Pilani, India) in 1994, received an MBA in Finance and Marketing from XLRI School of Management (Jamshedpur, India) in 1998, and received an MBA in Finance from University of Pennsylvania, the Wharton School, in 2008. He joined Harding Loevner in 2008. Mr. Chakrabortty serves as a co-lead portfolio manager for the Frontier Emerging Markets Portfolio and as a portfolio manager for the Institutional Emerging Markets Portfolio and Emerging Markets Portfolio. |
|
| Babatunde Ojo (2024-01-31) |
|
| Babatunde (Tunde
Babatunde Ojo is a co-lead portfolio manager of the Frontier Emerging Markets Equity strategy, portfolio manager of the International Equity strategy, and an analyst of frontier markets companies. He is a Partner of the firm. Prior to joining Harding Loevner, Tunde worked as an equity research analyst and portfolio manager at Asset & Resource Management Company in Nigeria and as a global research analyst intern at American Century Investments. He also previously served as an associate at PricewaterhouseCoopers and a banking officer at Intercontinental Bank in Nigeria. Tunde is a graduate of the University of Lagos with a BS in biochemistry, of Imperial College, University of London with an MSc in food chain management, and of the Wharton School of the University of Pennsylvania with an MBA in finance & management. He is also a CFA® charterholder. |
|
| Lee Gao (2023-01-31) |
|
| Mr. Gao is a portfolio manager within GSAM’s Global Emerging Markets Equity Team. Mr. Gao joined GSAM in April 2019 from GCA Investment Management where he served as a portfolio manager from 2017 to 2019. Prior to joining GCA Investment Management, he was head of research of the Caravel Emerging Markets Sustainability Fund at Caravel Management LLC, a portfolio manager at Visium Asset Management, and a director at Greyson Capital Management. |
|
|
|
|
|
|
|
|
|

© Copyright 2024 Morningstar, Inc. All rights reserved. Morningstar, the Morningstar logo, Morningstar.com, Morningstar Tools are either trademark or service marks of Morningstar, Inc. The information contained herein: (1) is proprietary to Morningstar and/or its content providers; (2) may not be copied or distributed; and (3) is not warranted to be accurate, complete or timely. Neither Morningstar nor its content providers are responsible for any damages or any losses arising from any use of information. Past performance is no guarantee of future performance. |
|
Past performance is no guarantee of future results.
Returns will vary and shares may be worth more or less than their original cost when sold.
|
|