| Hood River Small-Cap Growth Instl HRSMX |
|
 |
|
| Release date as of 2024-03-31. Data on page is subject to change. |
|
|
Overall Morningstar
Rating™
|
| What is this?
|
|
 |
| As of 2024-03-31 |
|
Out of 552
Small Growth Funds
|
|
|
|
|
|
| Total Fund Assets ($ Mil) |
| 2,277.26 |
|
|
|
| Investment Objective & Strategy |
|
| The investment seeks superior long-term growth of capital.
|
|
| The fund, under normal market conditions, invests at least 80% of its net assets plus any borrowings for investment purposes in common stocks of U.S. corporations that are judged by Hood River to have strong growth characteristics or to be undervalued in the marketplace relative to underlying profitability and have a market capitalization which, at the time of purchase, is consistent with the capitalization ranges of the S&P SmallCap 600® Index and the Russell 2000® Growth Index ("small-cap companies"). |
|
|
| Morningstar Category: Small Growth |
|
| Small-growth portfolios focus on faster-growing companies whose shares are at the lower end of the market-capitalization range. These portfolios tend to favor companies in up-and-coming industries or young firms in their early growth stages. Because these businesses are fast-growing and often richly valued, their stocks tend to be volatile. Stocks in the bottom 10% of the capitalization of the U.S. equity market are defined as small cap. Growth is defined based on fast growth (high growth rates for earnings, sales, book value, and cash flow) and high valuations (high price ratios and low dividend yields).
|
|
|
| Growth of $10,000 |
|
(from 2014-01-01
to 2024-03-31)
|
|
|
|
|
 |
Investment: |
Hood River Small-Cap Growth Instl |
 |
Benchmark 1: |
S&P 500 TR USD |
 |
Benchmark 2: |
Russell 2000 Growth TR USD |
 |
Category: |
Small Growth |
|
|
This graph presents historical performance for the investment as well as an index and/or peer group. If the investment, index and/or peer group have performed similarly, the line representing the fund will overlay the index and/or peer group. Therefore, the line(s) representing the index and/or peer group history may be hidden.
|
|
|
| Total Annualized Returns % |
|
|
YTD |
1 Year |
3 Year |
5 Year |
10 Year |
Since Inception |
| Investment |
14.03 |
30.42 |
3.52 |
15.72 |
13.11 |
12.95 |
| S&P 500 TR USD |
10.56 |
29.88 |
11.49 |
15.05 |
12.96 |
10.76 |
| Russell 2000 Growth TR USD |
7.58 |
20.35 |
-2.68 |
7.38 |
7.89 |
10.04 |
| Category |
7.49 |
18.05 |
-1.95 |
9.06 |
8.83 |
9.50 |
|
|
|
| Morningstar Rating |
--- |
--- |
 |
 |
|
--- |
|
|
# of compared
Small Growth
funds covered
(3 yrs : out of
552
funds)
(5 yrs : out of
520
funds)
(10 yrs : out of
400
funds)
|
|
|
|
| Ratings reflect risk-adjusted performance and are derived from a weighted average of the performance figures associated with its three, five and ten-year (if applicable) time periods. |
|
|
|
|
|
| Investment results shown represent historical performance and do not guarantee future results. Investment returns and principal values fluctuate with changes in interest rates and other market conditions so the value, when redeemed may be worth more or less than original costs. Current performance may be lower or higher than the performance data shown. |
|
|
|
Total Annual Operating Expense
|
1.07%
|
| Prospectus Net Expense Ratio |
1.07%
|
| Maximum Sales Charge |
--- |
|
| The total annual operating expense shown is before management fee waivers or expense caps. For more information on waivers/reimbursements, please see the prospectus. The total annual operating expense is also referred to as the prospectus gross expense ratio. |
|
|
Type |
Date |
% |
| --- |
--- |
--- |
--- |
|
|
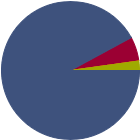
| % of Net Assets |
 |
U.S. Stocks |
92.0 |
 |
Non-U.S. Stocks |
5.7 |
 |
Bonds |
0.0 |
 |
Cash |
2.2 |
 |
Other |
0.0 |
|
|
 |
| Data through 2023-12-31 |
|
|
|
|
| Morningstar Equity Sectors |
|
|
|
% of Stocks |
 |
Cyclical |
19.99 |
 |
Basic Materials |
3.53 |
 |
Consumer Cyclical |
6.14 |
 |
Financial Services |
9.75 |
 |
Real Estate |
0.57 |
|
|
|
 |
Sensitive |
57.45 |
 |
Communication Services |
1.84 |
 |
Energy |
2.31 |
 |
Industrials |
26.04 |
 |
Technology |
27.26 |
|
|
|
 |
Defensive |
22.55 |
 |
Consumer Defensive |
1.68 |
 |
Healthcare |
20.87 |
 |
Utilities |
0.00 |
|
| Data through 2023-12-31 |
|
|
| Total Number of Stock Holdings |
92 |
| Total Number of Bond Holdings |
0 |
| % of Net Assets in Top 10 Holdings |
27.14 |
|
|
| Turnover % |
(as of 2023-06-30) |
95.00 |
| 30 Day SEC Yield % |
--- |
|
|
Sector |
P/E |
% of Net
Assets
|
 |
|
|
|
|
 |
FTAI Aviation Ltd |
|
31.90 |
4.32 |
|
Rambus Inc |
|
20.53 |
3.62 |
|
Western Alliance Bancorp |
|
9.81 |
2.78 |
|
Comfort Systems USA Inc |
|
35.26 |
2.68 |
|
Onto Innovation Inc |
|
73.61 |
2.60 |
 |
|
FirstCash Holdings Inc |
|
26.57 |
2.43 |
|
Vertiv Holdings Co Class A |
|
68.63 |
2.24 |
|
Axonics Inc |
|
--- |
2.19 |
|
FormFactor Inc |
|
43.46 |
2.17 |
|
MasTec Inc |
|
--- |
2.11 |
|
|
 |
|
|
|
|
|
| Event-Driven Investment/Arbitrage Strategies, Foreign Securities, Loss of Money, Not FDIC Insured, Growth Investing, High Portfolio Turnover, Market/Market Volatility, Depositary Receipts, Equity Securities, ETF, Industry and Sector Investing, IPO, Other, Preferred Stocks, Restricted/Illiquid Securities, Underlying Fund/Fund of Funds, Pricing, Suitability, Management, Small Cap, Technology Sector |
|
| Show Risk Definitions |
|
|
| Inception Date: 2003-01-02 |
|
| David G. Swank (2009-04-30) |
|
| David founded Hood River Capital Management, which spun out of Roxbury Capital Management, where he managed the Small-Cap Growth product for 5 years. Prior to Roxbury, David worked for GMT Capital Corporation as the healthcare sector head of a $4 billion long/short equity hedge fund. He previously worked at Morgan Stanley Investment Management and began his career as a research associate at Furman Selz and Montgomery Securities. David has a B.S. with Distinction from the University of Virginia and an M.B.A. from the Tuck School of Business at Dartmouth College. |
|
| Brian P. Smoluch (2003-01-02) |
|
| Brian founded Hood River Capital Management, which spun out of Roxbury Capital Management, where he managed the Small-Cap Growth product for 10 years. Prior to Roxbury, Brian was part of the small/mid-cap team at Columbia Management. He began his career as an investment banking financial analyst at Salomon Brothers in New York. Brian has a B.S. with Distinction from the University of Virginia and an M.B.A. in finance from Harvard University. |
|
|
|
| Hood River Capital Management LLC |
|
|
| Hood River Capital Management |
|
|

© Copyright 2024 Morningstar, Inc. All rights reserved. Morningstar, the Morningstar logo, Morningstar.com, Morningstar Tools are either trademark or service marks of Morningstar, Inc. The information contained herein: (1) is proprietary to Morningstar and/or its content providers; (2) may not be copied or distributed; and (3) is not warranted to be accurate, complete or timely. Neither Morningstar nor its content providers are responsible for any damages or any losses arising from any use of information. Past performance is no guarantee of future performance. |
|
Past performance is no guarantee of future results.
Returns will vary and shares may be worth more or less than their original cost when sold.
|
|