| Thornburg International Equity R5 TIVRX |
|
 |
|
| Release date as of 2024-03-31. Data on page is subject to change. |
|
|
Overall Morningstar
Rating™
|
| What is this?
|
|
 |
| As of 2024-03-31 |
|
Out of 696
Foreign Large Blend Funds
|
|
|
|
|
|
| Total Fund Assets ($ Mil) |
| 2,645.03 |
|
|
|
| Investment Objective & Strategy |
|
| The investment seeks long-term capital appreciation; current income is the secondary objective.
|
|
| The fund invests primarily in common stocks of non-U.S. companies and in depositary receipts associated with such stocks. The fund may invest in developing countries. Under normal conditions, the fund will invest at least 80% of its net assets in common stocks or depositary receipts. |
|
|
| Morningstar Category: Foreign Large Blend |
|
| Foreign large-blend portfolios invest in a variety of big international stocks. Most of these portfolios divide their assets among a dozen or more developed markets, including Japan, Britain, France, and Germany. These portfolios primarily invest in stocks that have market caps in the top 70% of each economically integrated market (such as Europe or Asia ex-Japan). The blend style is assigned to portfolios where neither growth nor value characteristics predominate. These portfolios typically will have less than 20% of assets invested in U.S. stocks.
|
|
|
| Growth of $10,000 |
|
(from 2014-01-01
to 2024-03-31)
|
|
|
|
|
 |
Investment: |
Thornburg International Equity R5 |
 |
Benchmark 1: |
MSCI ACWI Ex USA NR USD |
 |
Benchmark 2: |
MSCI ACWI Ex USA NR USD |
 |
Category: |
Foreign Large Blend |
|
|
This graph presents historical performance for the investment as well as an index and/or peer group. If the investment, index and/or peer group have performed similarly, the line representing the fund will overlay the index and/or peer group. Therefore, the line(s) representing the index and/or peer group history may be hidden.
|
|
|
| Total Annualized Returns % |
|
|
YTD |
1 Year |
3 Year |
5 Year |
10 Year |
Since Inception |
| Investment |
7.72 |
15.67 |
2.41 |
8.90 |
6.24 |
6.70 |
| MSCI ACWI Ex USA NR USD |
4.69 |
13.26 |
1.94 |
5.97 |
4.25 |
--- |
| MSCI ACWI Ex USA NR USD |
4.69 |
13.26 |
1.94 |
5.97 |
4.25 |
--- |
| Category |
5.24 |
13.54 |
2.92 |
6.56 |
4.53 |
3.89 |
|
|
|
| Morningstar Rating |
--- |
--- |
 |
 |
|
--- |
|
|
# of compared
Foreign Large Blend
funds covered
(3 yrs : out of
696
funds)
(5 yrs : out of
646
funds)
(10 yrs : out of
425
funds)
|
|
|
|
| Ratings reflect risk-adjusted performance and are derived from a weighted average of the performance figures associated with its three, five and ten-year (if applicable) time periods. |
|
|
|
|
|
| Investment results shown represent historical performance and do not guarantee future results. Investment returns and principal values fluctuate with changes in interest rates and other market conditions so the value, when redeemed may be worth more or less than original costs. Current performance may be lower or higher than the performance data shown. |
|
|
|
Total Annual Operating Expense
|
1.23%
|
| Prospectus Net Expense Ratio |
0.90%
|
| Maximum Sales Charge |
--- |
|
| The total annual operating expense shown is before management fee waivers or expense caps. For more information on waivers/reimbursements, please see the prospectus. The total annual operating expense is also referred to as the prospectus gross expense ratio. |
|
|
Type |
Date |
% |
| ExpenseRatio |
Contractual |
2025-02-01 |
0.33 |
|
|
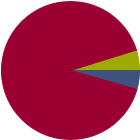
| % of Net Assets |
 |
U.S. Stocks |
4.4 |
 |
Non-U.S. Stocks |
90.8 |
 |
Bonds |
0.0 |
 |
Cash |
4.8 |
 |
Other |
0.0 |
|
|
 |
| Data through 2024-02-29 |
|
|
|
|
| Morningstar Equity Sectors |
|
|
|
% of Stocks |
 |
Cyclical |
27.65 |
 |
Basic Materials |
6.05 |
 |
Consumer Cyclical |
4.61 |
 |
Financial Services |
16.99 |
 |
Real Estate |
0.00 |
|
|
|
 |
Sensitive |
49.71 |
 |
Communication Services |
8.42 |
 |
Energy |
5.35 |
 |
Industrials |
21.45 |
 |
Technology |
14.49 |
|
|
|
 |
Defensive |
22.63 |
 |
Consumer Defensive |
8.69 |
 |
Healthcare |
6.15 |
 |
Utilities |
7.79 |
|
| Data through 2024-02-29 |
|
|
|
| Morningstar World Regions |
|
| % Fund |
| Americas |
11.5 |
|
| North America |
10.7 |
| Latin America |
0.8 |
|
| Greater Europe |
57.8 |
|
| United Kingdom |
5.4 |
| Europe Developed |
52.4 |
| Europe Emerging |
0.0 |
| Africa/Middle East |
0.0 |
|
| Greater Asia |
30.7 |
|
| Japan |
15.0 |
| Australasia |
0.0 |
| Asia Developed |
9.4 |
| Asia Emerging |
6.3 |
|
| Data through 2024-02-29 |
|
|
| Total Number of Stock Holdings |
55 |
| Total Number of Bond Holdings |
0 |
| % of Net Assets in Top 10 Holdings |
32.63 |
|
|
| Turnover % |
(as of 2023-09-30) |
48.88 |
| 30 Day SEC Yield % |
--- |
|
|
Sector |
Country |
% of Net
Assets
|
 |
|
|
|
|
 |
Thornburg Capital Management |
--- |
United States |
4.82 |
|
TotalEnergies SE |
|
France |
3.91 |
 |
NN Group NV |
|
Netherlands |
3.27 |
|
Safran SA |
|
France |
3.09 |
|
Schneider Electric SE |
|
France |
3.05 |
 |
|
Canadian Pacific Kansas City Ltd |
|
Canada |
2.94 |
|
Hitachi Ltd |
|
Japan |
2.94 |
|
Linde PLC |
|
United States |
2.91 |
|
L'Oreal SA |
|
France |
2.89 |
|
Rheinmetall AG |
|
Germany |
2.81 |
|
|
 |
|
|
|
|
|
| Credit and Counterparty, Currency, Foreign Securities, Loss of Money, Not FDIC Insured, Country or Region, Active Management, Issuer, Market/Market Volatility, Equity Securities, Other, Restricted/Illiquid Securities, Shareholder Activity, China Region, Management, Small Cap, Mid-Cap |
|
| Show Risk Definitions |
|
|
| Inception Date: 2005-02-01 |
|
| Lei Wang (2006-02-01) |
|
| Lei Wang is portfolio manager for Thornburg Investment Management. He joined Thornburg Investment Management in 2004 as associate portfolio manager and was promoted to portfolio manager in 2006.
Lei holds a BA and an MA from East China Normal University and an MBA from New York University. He is a CFA charterholder. Prior to joining Thornburg, he served as an associate for Deutsche Bank as well as for Enso Capital Management. He has also worked as a bank supervision manager at China’s central bank. |
|
| Matt Burdett (2021-01-15) |
|
| Matt Burdett is portfolio manager for Thornburg Investment Management. He rejoined the firm in 2015 as an associate portfolio manager and was promoted to portfolio manager in 2018. Matt spent several years as a senior vice president and portfolio manager at PIMCO, where he co-managed various dividend-oriented strategies. Prior to his time at PIMCO, Matt worked as an equity analyst at Thornburg.
Matt was director of healthcare investment banking at CIBC World Markets / Oppenheimer prior to joining Thornburg in 2010. Earlier in his career, he was a medicinal chemist at Sunesis Pharmaceuticals. Matt holds an MBA from the Marshall School of Business at the University of Southern California and a bachelor’s degree in chemistry from the University of California, Berkeley. |
|
|
|
| Thornburg Investment Management Inc |
|
|
|
|
|

© Copyright 2024 Morningstar, Inc. All rights reserved. Morningstar, the Morningstar logo, Morningstar.com, Morningstar Tools are either trademark or service marks of Morningstar, Inc. The information contained herein: (1) is proprietary to Morningstar and/or its content providers; (2) may not be copied or distributed; and (3) is not warranted to be accurate, complete or timely. Neither Morningstar nor its content providers are responsible for any damages or any losses arising from any use of information. Past performance is no guarantee of future performance. |
|
Past performance is no guarantee of future results.
Returns will vary and shares may be worth more or less than their original cost when sold.
|
|