| AMG TimesSquare Mid Cap Growth N TMDPX |
|
 |
|
| Release date as of 2024-03-31. Data on page is subject to change. |
|
|
Overall Morningstar
Rating™
|
| What is this?
|
|
 |
| As of 2024-03-31 |
|
Out of 520
Mid-Cap Growth Funds
|
|
|
|
|
|
| Total Fund Assets ($ Mil) |
| 1,412.45 |
|
|
|
| Investment Objective & Strategy |
|
| The investment seeks to achieve long-term capital appreciation.
|
|
| The fund invests at least 80% of its net assets, plus the amount of any borrowings for investment purposes, in common and preferred stocks of U.S. mid-capitalization companies. The subadviser considers the term "mid-capitalization companies" to refer to companies that, at the time of purchase, are within the range of capitalizations of companies in the Russell Midcap® Growth Index. |
|
|
| Morningstar Category: Mid-Cap Growth |
|
| Some mid-cap growth portfolios invest in stocks of all sizes, thus leading to a mid-cap profile, but others focus on midsize companies. Mid-cap growth portfolios target U.S. firms that are projected to grow faster than other mid-cap stocks, therefore commanding relatively higher prices. Stocks in the middle 20% of the capitalization of the U.S. equity market are defined as mid-cap. Growth is defined based on fast growth (high growth rates for earnings, sales, book value, and cash flow) and high valuations (high price ratios and low dividend yields).
|
|
|
| Growth of $10,000 |
|
(from 2014-01-01
to 2024-03-31)
|
|
|
|
|
 |
Investment: |
AMG TimesSquare Mid Cap Growth N |
 |
Benchmark 1: |
S&P 500 TR USD |
 |
Benchmark 2: |
Russell Mid Cap Growth TR USD |
 |
Category: |
Mid-Cap Growth |
|
|
This graph presents historical performance for the investment as well as an index and/or peer group. If the investment, index and/or peer group have performed similarly, the line representing the fund will overlay the index and/or peer group. Therefore, the line(s) representing the index and/or peer group history may be hidden.
|
|
|
| Total Annualized Returns % |
|
|
YTD |
1 Year |
3 Year |
5 Year |
10 Year |
Since Inception |
| Investment |
9.80 |
27.64 |
7.28 |
14.06 |
11.38 |
10.89 |
| S&P 500 TR USD |
10.56 |
29.88 |
11.49 |
15.05 |
12.96 |
10.10 |
| Russell Mid Cap Growth TR USD |
9.50 |
26.28 |
4.62 |
11.82 |
11.35 |
10.31 |
| Category |
9.42 |
23.04 |
1.14 |
10.63 |
10.12 |
8.79 |
|
|
|
| Morningstar Rating |
--- |
--- |
 |
|
|
--- |
|
|
# of compared
Mid-Cap Growth
funds covered
(3 yrs : out of
520
funds)
(5 yrs : out of
489
funds)
(10 yrs : out of
393
funds)
|
|
|
|
| Ratings reflect risk-adjusted performance and are derived from a weighted average of the performance figures associated with its three, five and ten-year (if applicable) time periods. |
|
|
|
|
|
| Investment results shown represent historical performance and do not guarantee future results. Investment returns and principal values fluctuate with changes in interest rates and other market conditions so the value, when redeemed may be worth more or less than original costs. Current performance may be lower or higher than the performance data shown. |
|
|
|
Total Annual Operating Expense
|
1.18%
|
| Prospectus Net Expense Ratio |
1.18%
|
| Maximum Sales Charge |
--- |
|
| The total annual operating expense shown is before management fee waivers or expense caps. For more information on waivers/reimbursements, please see the prospectus. The total annual operating expense is also referred to as the prospectus gross expense ratio. |
|
|
Type |
Date |
% |
| --- |
--- |
--- |
--- |
|
|
| % of Net Assets |
 |
U.S. Stocks |
89.6 |
 |
Non-U.S. Stocks |
7.1 |
 |
Bonds |
0.0 |
 |
Cash |
3.3 |
 |
Other |
0.0 |
|
|
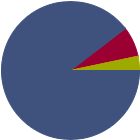 |
| Data through 2024-03-31 |
|
|
|
|
| Morningstar Equity Sectors |
|
|
|
% of Stocks |
 |
Cyclical |
19.24 |
 |
Basic Materials |
2.35 |
 |
Consumer Cyclical |
8.63 |
 |
Financial Services |
5.70 |
 |
Real Estate |
2.56 |
|
|
|
 |
Sensitive |
59.02 |
 |
Communication Services |
3.01 |
 |
Energy |
2.75 |
 |
Industrials |
23.02 |
 |
Technology |
30.24 |
|
|
|
 |
Defensive |
21.73 |
 |
Consumer Defensive |
1.36 |
 |
Healthcare |
20.37 |
 |
Utilities |
0.00 |
|
| Data through 2024-03-31 |
|
|
| Total Number of Stock Holdings |
73 |
| Total Number of Bond Holdings |
0 |
| % of Net Assets in Top 10 Holdings |
23.41 |
|
|
| Turnover % |
(as of 2023-12-31) |
39.00 |
| 30 Day SEC Yield % |
--- |
|
|
Sector |
P/E |
% of Net
Assets
|
 |
|
|
|
|
|
Cintas Corp |
|
47.41 |
2.85 |
|
CrowdStrike Holdings Inc Class A |
|
866.46 |
2.73 |
|
Cencora Inc |
|
26.47 |
2.50 |
 |
O'Reilly Automotive Inc |
|
29.34 |
2.39 |
|
Veeva Systems Inc Class A |
|
71.95 |
2.30 |
 |
|
Gartner Inc |
|
43.02 |
2.29 |
|
Waste Connections Inc |
|
--- |
2.16 |
|
DexCom Inc |
|
106.69 |
2.11 |
|
Chemed Corp |
|
35.80 |
2.10 |
|
RenaissanceRe Holdings Ltd |
|
4.50 |
1.98 |
|
|
 |
|
|
|
|
|
| Loss of Money, Not FDIC Insured, Growth Investing, Active Management, Market/Market Volatility, Industry and Sector Investing, Mid-Cap |
|
| Show Risk Definitions |
|
|
| Inception Date: 2005-03-04 |
|
| Grant R. Babyak (2005-03-04) |
|
| Grant is a Senior Founding Partner, Managing Director, and Portfolio Manager in TimesSquare’s growth equity group. He is also a member of the three-person Management Committee that oversees TimesSquare. Prior to joining TimesSquare in 2000, Grant managed small cap and mid cap portfolios at Fiduciary Trust Company International. He previously worked for six years at Avatar Associates as an institutional portfolio manager and for two years at U.S. Trust Company of New York as an analyst covering the consumer and basic industrial sectors. Grant has a B.A. in Political Science from Yale University and an M.B.A. in Finance from the Leonard N. Stern School of Business at New York University. |
|
| Sonu Chawla (2022-05-04) |
|
| Ms. Chawla has served as co-manager of the Fund since May 2022. She is a Director, Portfolio Manager/Analyst, and Partner in TimesSquare’s growth equity group and has 22 years of experience. She is responsible for research coverage of the Software, Technology Services, and Internet & Communications sectors within the technology, media and telecommunications (“TMT”) industry. Ms. Chawla joined TimesSquare in August 2018 from Pine River Capital Management, a multi-strategy hedge fund where she was a Senior Analyst covering TMT sectors across Software, Internet, Services, Hardware and Telecom. Her previous research analyst experiences were as a Senior TMT Analyst at Surveyor Capital platform of Citadel and an Analyst at Fred Alger Management. Ms. Chawla has an M.S. in Mathematics and Computer Science from Indian Institute of Technology, Delhi and an M.B.A from Kellogg School of Management at Northwestern University. She is a member of the CFA Institute and the CFA Society New York. Ms. Chawla is conversational in Hindi. |
|
|
|
|
|
|
|
|
|

© Copyright 2024 Morningstar, Inc. All rights reserved. Morningstar, the Morningstar logo, Morningstar.com, Morningstar Tools are either trademark or service marks of Morningstar, Inc. The information contained herein: (1) is proprietary to Morningstar and/or its content providers; (2) may not be copied or distributed; and (3) is not warranted to be accurate, complete or timely. Neither Morningstar nor its content providers are responsible for any damages or any losses arising from any use of information. Past performance is no guarantee of future performance. |
|
Past performance is no guarantee of future results.
Returns will vary and shares may be worth more or less than their original cost when sold.
|
|