| Victory Sycamore Established Value I VEVIX |
|
 |
|
| Release date as of 2024-03-31. Data on page is subject to change. |
|
|
Overall Morningstar
Rating™
|
| What is this?
|
|
 |
| As of 2024-03-31 |
|
Out of 380
Mid-Cap Value Funds
|
|
|
|
|
|
| Total Fund Assets ($ Mil) |
| 19,241.46 |
|
|
|
| Investment Objective & Strategy |
|
| The investment seeks to provide long-term capital growth by investing primarily in common stocks.
|
|
| Under normal circumstances, at least 80% of the fund's assets will be invested in equity securities of companies with market capitalizations, at the time of purchase, within the range of companies comprising the Russell Midcap® Value Index. It may invest a portion of its assets in equity securities of foreign companies traded in the U.S., including American Depositary Receipts and Global Depositary Receipts ("ADRs" and "GDRs"). |
|
|
| Morningstar Category: Mid-Cap Value |
|
| Some mid-cap value portfolios focus on medium-size companies while others land here because they own a mix of small-, mid-, and large-cap stocks. All look for U.S. stocks that are less expensive or growing more slowly than the market. Stocks in the middle 20% of the capitalization of the U.S. equity market are defined as mid-cap. Value is defined based on low valuations (low price ratios and high dividend yields) and slow growth (low growth rates for earnings, sales, book value, and cash flow).
|
|
|
| Growth of $10,000 |
|
(from 2014-01-01
to 2024-03-31)
|
|
|
|
|
 |
Investment: |
Victory Sycamore Established Value I |
 |
Benchmark 1: |
S&P 500 TR USD |
 |
Benchmark 2: |
Russell Mid Cap Value TR USD |
 |
Category: |
Mid-Cap Value |
|
|
This graph presents historical performance for the investment as well as an index and/or peer group. If the investment, index and/or peer group have performed similarly, the line representing the fund will overlay the index and/or peer group. Therefore, the line(s) representing the index and/or peer group history may be hidden.
|
|
|
| Total Annualized Returns % |
|
|
YTD |
1 Year |
3 Year |
5 Year |
10 Year |
Since Inception |
| Investment |
9.21 |
18.40 |
9.99 |
13.65 |
11.62 |
13.02 |
| S&P 500 TR USD |
10.56 |
29.88 |
11.49 |
15.05 |
12.96 |
11.51 |
| Russell Mid Cap Value TR USD |
8.23 |
20.40 |
6.80 |
9.94 |
8.57 |
--- |
| Category |
7.75 |
20.80 |
8.00 |
10.61 |
8.23 |
10.59 |
|
|
|
| Morningstar Rating |
--- |
--- |
 |
 |
|
--- |
|
|
# of compared
Mid-Cap Value
funds covered
(3 yrs : out of
380
funds)
(5 yrs : out of
363
funds)
(10 yrs : out of
281
funds)
|
|
|
|
| Ratings reflect risk-adjusted performance and are derived from a weighted average of the performance figures associated with its three, five and ten-year (if applicable) time periods. |
|
|
|
|
|
| Investment results shown represent historical performance and do not guarantee future results. Investment returns and principal values fluctuate with changes in interest rates and other market conditions so the value, when redeemed may be worth more or less than original costs. Current performance may be lower or higher than the performance data shown. |
|
|
|
Total Annual Operating Expense
|
0.58%
|
| Prospectus Net Expense Ratio |
0.58%
|
| Maximum Sales Charge |
--- |
|
| The total annual operating expense shown is before management fee waivers or expense caps. For more information on waivers/reimbursements, please see the prospectus. The total annual operating expense is also referred to as the prospectus gross expense ratio. |
|
|
Type |
Date |
% |
| --- |
--- |
--- |
--- |
|
|
| % of Net Assets |
 |
U.S. Stocks |
92.4 |
 |
Non-U.S. Stocks |
5.8 |
 |
Bonds |
0.0 |
 |
Cash |
1.8 |
 |
Other |
0.0 |
|
|
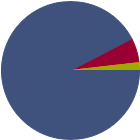 |
| Data through 2024-03-31 |
|
|
|
|
| Morningstar Equity Sectors |
|
|
|
% of Stocks |
 |
Cyclical |
43.58 |
 |
Basic Materials |
5.62 |
 |
Consumer Cyclical |
15.39 |
 |
Financial Services |
14.73 |
 |
Real Estate |
7.84 |
|
|
|
 |
Sensitive |
38.39 |
 |
Communication Services |
0.02 |
 |
Energy |
5.05 |
 |
Industrials |
22.11 |
 |
Technology |
11.21 |
|
|
|
 |
Defensive |
18.02 |
 |
Consumer Defensive |
5.24 |
 |
Healthcare |
9.50 |
 |
Utilities |
3.28 |
|
| Data through 2024-03-31 |
|
|
| Total Number of Stock Holdings |
74 |
| Total Number of Bond Holdings |
0 |
| % of Net Assets in Top 10 Holdings |
18.40 |
|
|
| Turnover % |
(as of 2023-06-30) |
28.00 |
| 30 Day SEC Yield % |
1.11 |
|
|
Sector |
P/E |
% of Net
Assets
|
 |
|
|
|
|
 |
NNN REIT Inc |
|
--- |
1.96 |
 |
Textron Inc |
|
20.99 |
1.92 |
|
Willis Towers Watson PLC |
|
--- |
1.87 |
|
The Hartford Financial Services Group Inc |
|
12.93 |
1.86 |
|
American Financial Group Inc |
|
13.58 |
1.86 |
 |
 |
Target Corp |
|
19.82 |
1.84 |
|
Quest Diagnostics Inc |
|
17.77 |
1.80 |
|
Alliant Energy Corp |
|
18.13 |
1.77 |
|
Packaging Corp of America |
|
22.38 |
1.77 |
|
MKS Instruments Inc |
|
--- |
1.75 |
|
|
 |
|
|
|
|
|
| Foreign Securities, Long-Term Outlook and Projections, Loss of Money, Not FDIC Insured, Market/Market Volatility, Equity Securities, Industry and Sector Investing, Restricted/Illiquid Securities, Management, Mid-Cap |
|
| Show Risk Definitions |
|
|
| Inception Date: 2010-03-01 |
|
| Jeffrey M. Graff (2007-03-01) |
|
| Jeffrey Graff is a portfolio manager for the Sycamore Capital Small Cap Value Equity and Mid Cap Value Equity strategies. Mr. Graff joined Victory Capital in 2001 with six years’ prior investment experience. Previously, he was employed as an equity analyst with A.G. Edwards & Sons. He began his career in the investment industry as an equity research associate for Roulston & Company. Mr. Graff holds a B.B.A. from Cleveland State University and an M.Fin. from St. Louis University. He is a CFA® charterholder.Mr. Graff began his investment career in 1994. |
|
| James M. Albers (2012-12-31) |
|
| James Albers is a portfolio manager for the Sycamore Capital Small Cap Value Equity and Mid Cap Value Equity strategies. Mr. Albers joined Victory Capital in 2005.Mr. Albers began his investment career in 1997. Previously, he worked as a consultant with Accenture and IBM Global Services. Mr. Albers earned a B.S. and an MBA from the University of Wisconsin. He is a CFA® charterholder. |
|
| Michael F. Rodarte (2012-12-31) |
|
| Michael Rodarte is a portfolio manager for the Sycamore Capital Small Cap Value Equity and Mid Cap Value Equity strategies. Mr. Rodarte joined Victory Capital in 2006. Previously, he worked as an analyst with KeyBanc Capital Markets in its corporate and investment banking groups. Mr. Rodarte earned his B.B.A. in finance, economics, and international business from Ohio University. He is a CFA® charterholder. |
|
| Gregory M. Conners (2002-03-01) |
|
| Greg Conners is a portfolio manager for the Sycamore Capital Small Cap Value Equity and Mid Cap Value Equity strategies. Mr. Conners joined Victory Capital in 1999 with four years’ prior investment experience as a small-cap research analyst with Carillon Advisers. Prior to his tenure as portfolio manager, he served as a research analyst for the Small Cap Value Equity strategy. Mr. Conners holds a B.S. in economics from College of Mount St. Joseph and an MBA from Xavier University. |
|
| Gary H. Miller (1998-07-31) |
|
| Gary Miller is Chief Investment Officer of Sycamore Capital. He is also lead portfolio manager of the Small Cap Value Equity and Mid Cap Value Equity strategies. The Victory Small Cap Value Equity and Mid Cap Value Equity team was renamed Sycamore Capital on April 1, 2015. Sycamore Capital is a Victory Capital investment franchise. Mr. Miller joined Victory Capital in 1987. Prior to his tenure as portfolio manager, he served as an equity research analyst for the Small Cap Value and Mid Cap Value Equity strategies. Mr. Miller holds a B.B.A. in accounting from the University of Cincinnati and an MBA from Xavier University. |
|
|
|
| Victory Capital Management Inc. |
|
|
|
|
|

© Copyright 2024 Morningstar, Inc. All rights reserved. Morningstar, the Morningstar logo, Morningstar.com, Morningstar Tools are either trademark or service marks of Morningstar, Inc. The information contained herein: (1) is proprietary to Morningstar and/or its content providers; (2) may not be copied or distributed; and (3) is not warranted to be accurate, complete or timely. Neither Morningstar nor its content providers are responsible for any damages or any losses arising from any use of information. Past performance is no guarantee of future performance. |
|
Past performance is no guarantee of future results.
Returns will vary and shares may be worth more or less than their original cost when sold.
|
|