| Fidelity Contrafund K6 FLCNX |
|
 |
|
| Release date as of 2025-09-30. Data on page is subject to change. |
|
|
Overall Morningstar
Rating™
|
| What is this?
|
|
 |
| As of 2025-09-30 |
|
Out of 1024
Large Growth Funds
|
|
|
|
|
|
| Total Fund Assets ($ Mil) |
| 37,480.92 |
|
|
|
| Investment Objective & Strategy |
|
| The investment seeks capital appreciation.
|
|
| The fund normally invests primarily in common stocks. It invests in securities of companies whose value Fidelity Management & Research Company (FMR) believes is not fully recognized by the public. The fund invests in domestic and foreign issuers. |
|
|
| Morningstar Category: Large Growth |
|
| Large-growth portfolios invest primarily in big U.S. companies that are projected to grow faster than other large-cap stocks. Stocks in the top 70% of the capitalization of the U.S. equity market are defined as large cap. Growth is defined based on fast growth (high growth rates for earnings, sales, book value, and cash flow) and high valuations (high price ratios and low dividend yields). Most of these portfolios focus on companies in rapidly expanding industries.
|
|
|
| Growth of $10,000 |
|
(from 2017-05-25 to 2025-09-30)
|
|
|
|
|
 |
Investment: |
Fidelity Contrafund K6 |
 |
Benchmark 1: |
S&P 500 TR USD |
 |
Benchmark 2: |
Russell 1000 Growth TR USD |
 |
Category: |
Large Growth |
|
|
This graph presents historical performance for the investment as well as an index and/or peer group. If the investment, index and/or peer group have performed similarly, the line representing the fund will overlay the index and/or peer group. Therefore, the line(s) representing the index and/or peer group history may be hidden.
|
|
|
| Total Annualized Returns % |
|
|
YTD |
1 Year |
3 Year |
5 Year |
10 Year |
Since Inception |
| Investment |
19.77 |
23.66 |
32.68 |
16.83 |
--- |
17.53 |
| S&P 500 TR USD |
14.83 |
17.60 |
24.94 |
16.47 |
--- |
14.89 |
| Russell 1000 Growth TR USD |
17.24 |
25.53 |
31.61 |
17.58 |
--- |
19.02 |
| Category |
15.25 |
21.73 |
28.11 |
13.71 |
--- |
15.27 |
|
|
|
| Morningstar Rating |
--- |
--- |
 |
|
--- |
--- |
|
|
# of compared
Large Growth
funds covered
(3 yrs : out of
1024
funds)
(5 yrs : out of
954
funds)
(10 yrs : out of
766
funds)
|
|
|
|
| Ratings reflect risk-adjusted performance and are derived from a weighted average of the performance figures associated with its three, five and ten-year (if applicable) time periods. |
|
|
|
|
|
| Investment results shown represent historical performance and do not guarantee future results. Investment returns and principal values fluctuate with changes in interest rates and other market conditions so the value, when redeemed may be worth more or less than original costs. Current performance may be lower or higher than the performance data shown. |
|
|
|
Total Annual Operating Expense
|
0.45%
|
| Prospectus Net Expense Ratio |
0.45%
|
| Maximum Sales Charge |
--- |
|
| The total annual operating expense shown is before management fee waivers or expense caps. For more information on waivers/reimbursements, please see the prospectus. The total annual operating expense is also referred to as the prospectus gross expense ratio. |
|
|
Type |
Date |
% |
| --- |
--- |
--- |
--- |
|
|
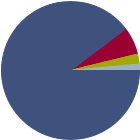
| % of Net Assets |
 |
U.S. Stocks |
89.7 |
 |
Non-U.S. Stocks |
6.5 |
 |
Bonds |
0.0 |
 |
Cash |
2.3 |
 |
Other |
1.5 |
|
|
 |
| Data through 2025-08-31 |
|
|
|
|
| Morningstar Equity Sectors |
|
|
|
% of Stocks |
 |
Cyclical |
30.75 |
 |
Basic Materials |
1.54 |
 |
Consumer Cyclical |
10.71 |
 |
Financial Services |
18.31 |
 |
Real Estate |
0.19 |
|
|
|
 |
Sensitive |
60.42 |
 |
Communication Services |
25.84 |
 |
Energy |
0.75 |
 |
Industrials |
6.80 |
 |
Technology |
27.03 |
|
|
|
 |
Defensive |
8.81 |
 |
Consumer Defensive |
2.21 |
 |
Healthcare |
5.40 |
 |
Utilities |
1.20 |
|
| Data through 2025-08-31 |
|
|
| Total Number of Stock Holdings |
343 |
| Total Number of Bond Holdings |
1 |
| % of Net Assets in Top 10 Holdings |
56.43 |
|
|
| Turnover % |
(as of 2024-12-31) |
19.00 |
| 30 Day SEC Yield % |
--- |
|
|
Sector |
P/E |
% of Net
Assets
|
 |
|
|
|
|
 |
Meta Platforms Inc Class A |
|
26.00 |
15.81 |
|
NVIDIA Corp |
|
52.05 |
10.78 |
|
Berkshire Hathaway Inc Class A |
|
16.88 |
7.34 |
|
Amazon.com Inc |
|
32.48 |
5.79 |
|
Microsoft Corp |
|
37.65 |
4.90 |
 |
|
Netflix Inc |
|
51.10 |
2.74 |
|
Amphenol Corp Class A |
|
50.06 |
2.46 |
|
Alphabet Inc Class A |
|
27.00 |
2.43 |
|
Fidelity Cash Central Fund |
--- |
--- |
2.25 |
|
Apple Inc |
|
38.28 |
1.93 |
|
|
 |
|
|
|
|
|
| Foreign Securities, Loss of Money, Not FDIC Insured, Growth Investing, Value Investing, Issuer, Market/Market Volatility, Equity Securities |
|
| Show Risk Definitions |
|
|
| Inception Date: 2017-05-25 |
|
| Asher Anolic (2025-04-11) |
|
| Asher Anolic is co-manager of the VIP Growth Portfolio, which he has managed since July 2017. He also manages other funds. Since joining Fidelity Investments in 2008, Mr. Anolic has worked as a research analyst and portfolio manager. Prior to joining Fidelity Investments in 2008, Mr. Anolic worked for Bear Stearns as a research analyst. |
|
| William Danoff (2017-05-25) |
|
| Mr. Danoff has worked as a research analyst and portfolio manager since joining Fidelity Investments in 1986. Prior to joining the firm, he was a research analyst for Furman Selz in New York City, covering advertising stocks and special situations. |
|
| Jason Weiner (2025-04-11) |
|
| Jason Weiner is co-manager of the fund, which he has managed since November 2006. He also manages Fidelity funds. Since joining Fidelity Investments in 1991, Mr. Weiner has worked as a research analyst and portfolio manager (other than a 6-month leave of absence in 2018). |
|
|
|
| Fidelity Management & Research Company LLC |
|
|
|
|
|

© Copyright 2025 Morningstar, Inc. All rights reserved. Morningstar, the Morningstar logo, Morningstar.com, Morningstar Tools are either trademark or service marks of Morningstar, Inc. The information contained herein: (1) is proprietary to Morningstar and/or its content providers; (2) may not be copied or distributed; and (3) is not warranted to be accurate, complete or timely. Neither Morningstar nor its content providers are responsible for any damages or any losses arising from any use of information. Past performance is no guarantee of future performance. |
|
Past performance is no guarantee of future results.
Returns will vary and shares may be worth more or less than their original cost when sold.
|
|