| Harbor Capital Appreciation Retirement HNACX |
|
 |
|
| Release date as of 2025-09-30. Data on page is subject to change. |
|
|
Overall Morningstar
Rating™
|
| What is this?
|
|
 |
| As of 2025-09-30 |
|
Out of 1024
Large Growth Funds
|
|
|
|
|
|
| Total Fund Assets ($ Mil) |
| 29,018.51 |
|
|
|
| Investment Objective & Strategy |
|
| The investment seeks long-term growth of capital.
|
|
| The fund invests primarily in equity securities, principally common and preferred stocks, of U.S. companies with market capitalizations of at least $1 billion at the time of purchase and that the Subadvisor considers to have above average prospects for growth. The stocks of mid and large cap companies in the fund's portfolio are those the Subadvisor expects to maintain or achieve above average earnings growth. The fund may invest up to 20% of its total assets in the securities of foreign issuers, including issuers located or doing business in emerging markets. |
|
|
| Morningstar Category: Large Growth |
|
| Large-growth portfolios invest primarily in big U.S. companies that are projected to grow faster than other large-cap stocks. Stocks in the top 70% of the capitalization of the U.S. equity market are defined as large cap. Growth is defined based on fast growth (high growth rates for earnings, sales, book value, and cash flow) and high valuations (high price ratios and low dividend yields). Most of these portfolios focus on companies in rapidly expanding industries.
|
|
|
| Growth of $10,000 |
|
(from 2016-03-01 to 2025-09-30)
|
|
|
|
|
 |
Investment: |
Harbor Capital Appreciation Retirement |
|
|
This graph presents historical performance for the investment as well as an index and/or peer group. If the investment, index and/or peer group have performed similarly, the line representing the fund will overlay the index and/or peer group. Therefore, the line(s) representing the index and/or peer group history may be hidden.
|
|
|
| Total Annualized Returns % |
|
|
YTD |
1 Year |
3 Year |
5 Year |
10 Year |
Since Inception |
| Investment |
13.10 |
20.16 |
30.82 |
13.04 |
17.21 |
18.12 |
| S&P 500 TR USD |
14.83 |
17.60 |
24.94 |
16.47 |
15.30 |
11.67 |
| Russell 1000 Growth TR USD |
17.24 |
25.53 |
31.61 |
17.58 |
18.83 |
12.32 |
| Category |
15.25 |
21.73 |
28.11 |
13.71 |
15.90 |
10.55 |
|
|
|
| Morningstar Rating |
--- |
--- |
 |
 |
|
--- |
|
|
# of compared
Large Growth
funds covered
(3 yrs : out of
1024
funds)
(5 yrs : out of
954
funds)
(10 yrs : out of
766
funds)
|
|
|
|
| Ratings reflect risk-adjusted performance and are derived from a weighted average of the performance figures associated with its three, five and ten-year (if applicable) time periods. |
|
|
|
|
|
| Investment results shown represent historical performance and do not guarantee future results. Investment returns and principal values fluctuate with changes in interest rates and other market conditions so the value, when redeemed may be worth more or less than original costs. Current performance may be lower or higher than the performance data shown. |
|
|
|
Total Annual Operating Expense
|
0.64%
|
| Prospectus Net Expense Ratio |
0.59%
|
| Maximum Sales Charge |
--- |
|
| The total annual operating expense shown is before management fee waivers or expense caps. For more information on waivers/reimbursements, please see the prospectus. The total annual operating expense is also referred to as the prospectus gross expense ratio. |
|
|
Type |
Date |
% |
| ManagementFee |
Contractual |
2026-02-28 |
0.05 |
|
|
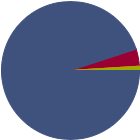
| % of Net Assets |
 |
U.S. Stocks |
95.0 |
 |
Non-U.S. Stocks |
4.0 |
 |
Bonds |
0.0 |
 |
Cash |
1.0 |
 |
Other |
0.0 |
|
|
 |
| Data through 2025-09-30 |
|
|
|
|
| Morningstar Equity Sectors |
|
|
|
% of Stocks |
 |
Cyclical |
20.84 |
 |
Basic Materials |
0.00 |
 |
Consumer Cyclical |
15.43 |
 |
Financial Services |
5.41 |
 |
Real Estate |
0.00 |
|
|
|
 |
Sensitive |
68.36 |
 |
Communication Services |
18.58 |
 |
Energy |
0.00 |
 |
Industrials |
4.55 |
 |
Technology |
45.23 |
|
|
|
 |
Defensive |
10.81 |
 |
Consumer Defensive |
3.00 |
 |
Healthcare |
6.31 |
 |
Utilities |
1.50 |
|
| Data through 2025-09-30 |
|
|
| Total Number of Stock Holdings |
49 |
| Total Number of Bond Holdings |
0 |
| % of Net Assets in Top 10 Holdings |
55.96 |
|
|
| Turnover % |
(as of 2024-10-31) |
28.00 |
| 30 Day SEC Yield % |
--- |
|
|
Sector |
P/E |
% of Net
Assets
|
 |
|
|
|
|
|
NVIDIA Corp |
|
52.05 |
11.90 |
|
Microsoft Corp |
|
37.65 |
7.18 |
 |
Amazon.com Inc |
|
32.48 |
6.86 |
|
Broadcom Inc |
|
89.80 |
6.17 |
 |
Apple Inc |
|
38.28 |
5.82 |
 |
|
Meta Platforms Inc Class A |
|
26.00 |
5.53 |
|
Tesla Inc |
|
253.94 |
3.77 |
|
Netflix Inc |
|
51.10 |
3.64 |
|
Alphabet Inc Class C |
|
27.06 |
2.62 |
|
Alphabet Inc Class A |
|
27.00 |
2.47 |
|
|
 |
|
|
|
|
|
| Foreign Securities, Loss of Money, Not FDIC Insured, Growth Investing, Issuer, Market/Market Volatility, Depositary Receipts, Equity Securities, Industry and Sector Investing, Preferred Stocks, Socially Conscious, Management, Mid-Cap, Large Cap, Technology Sector |
|
| Show Risk Definitions |
|
|
| Inception Date: 2016-03-01 |
| Initial Shareclass Inception Date: 1987-12-29 |
|
| Natasha Kuhlkin (2019-03-01) |
|
| Natasha Kuhlkin is a large cap growth equity portfolio manager. She joined the firm in 2004 as a research analyst and became a portfolio manager in 2014. Before joining Jennison, Natasha was an equity research analyst for the small cap value fund at Palisade Capital Management and prior to that at Evergreen Investment Management. Natasha received a BS in accounting from Binghamton University and is a CFA charterholder. |
|
| Owuraka Koney (2025-07-01) |
|
| Owuraka Koney is an equity research analyst covering industrials, consumer, internet, and media companies. He joined Jennison in 2007. Previously, Owuraka worked as an equity research associate covering the aerospace & defense and small cap media sectors at UBS. Owuraka received a BA in economics and political science from Williams College and is a CFA charterholder. |
|
| Blair A. Boyer (2019-03-01) |
|
| Blair Boyer is co-head of the large cap growth equity team and a large cap growth equity portfolio manager. He is responsible for overseeing the investment process, strategy implementation, and risk management for Jennison's large cap growth equity portfolios. He joined Jennison in 1993 as an international equity analyst before assuming his current role as portfolio manager in 2003. Prior to that, he was with Bleichroeder managing international equity portfolios and at Verus Capital as a senior portfolio manager. Blair received a BA in economics from Bucknell University and an MBA from New York University's Stern School of Business. |
|
| Kathleen A. McCarragher (2013-03-01) |
|
| Kathleen McCarragher is the head of growth equity and a large cap growth equity portfolio manager. She is responsible for overseeing the investment process, strategy implementation, and risk management for Jennison's growth equity platform. Kathleen is also a member of the Jennison Management Team, ESG Investment Leadership Team, and Jennison Board of Directors. Before joining Jennison in 1998, she was a managing director and the director of large cap growth equities with Weiss, Peck & Greer. Prior to that, she was an investor with State Street Research & Management. Kathleen received a BBA, summa cum laude, in finance and economics from the University of Wisconsin-Eau Claire and an MBA from Harvard Business School. |
|
|
|
| Harbor Capital Advisors Inc |
|
|
|
|
|

© Copyright 2025 Morningstar, Inc. All rights reserved. Morningstar, the Morningstar logo, Morningstar.com, Morningstar Tools are either trademark or service marks of Morningstar, Inc. The information contained herein: (1) is proprietary to Morningstar and/or its content providers; (2) may not be copied or distributed; and (3) is not warranted to be accurate, complete or timely. Neither Morningstar nor its content providers are responsible for any damages or any losses arising from any use of information. Past performance is no guarantee of future performance. |
|
Past performance is no guarantee of future results.
Returns will vary and shares may be worth more or less than their original cost when sold.
|
|