| PIMCO VIT Dynamic Bond Instl |
|
 |
|
| Release date as of 2025-08-31. Data on page is subject to change. |
|
|
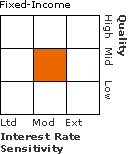
Overall Morningstar
Rating™
|
| What is this?
|
|
 |
| As of 2025-08-31 |
|
Out of 241
Nontraditional Bond Funds
|
|
|
|
|
|
| Total Fund Assets ($ Mil) |
| 89.92 |
|
|
|
| Investment Objective & Strategy |
|
| The investment seeks maximum long-term return, consistent with preservation of capital and prudent investment management.
|
|
| The portfolio seeks to achieve its investment objective by investing under normal circumstances at least 80% of its assets in a diversified portfolio of Fixed Income Instruments of varying maturities, which may be represented by forwards or derivatives such as options, futures contracts, or swap agreements. "Fixed Income Instruments" include bonds, debt securities and other similar instruments issued by various U.S. and non-U.S. public- or private-sector entities. |
|
|
| Morningstar Category: Nontraditional Bond |
|
| Inclusion in nontraditional bond is informed by a balance of factors determined by Morningstar analysts. Those typically include a mix of: absolute return mandates; goals of producing returns not correlated with the overall bond market; performance benchmarks based on ultrashort-term interest rates such as T-bills; the ability to take long and short market and security-level positions using a broad range of derivatives; and few or very limited portfolio constraints on exposure to credit, sectors, currency, or interest-rate sensitivity. Funds in this group typically have the flexibility to manage duration exposure over a wide range of years and to take it to zero or a negative value.
|
|
|
| There are no additional fund specific investment risks (e.g. liquidity risk, currency risk, foreign investment risk, etc.) associated with this fund beyond the normal risks generally associated with investing in a mutual fund. |
|
|
|
% of Net Assets |
|
| U.S. Stocks |
0.0 |
|
| Non-U.S. Stocks |
0.1 |
|
| Bonds |
157.6 |
|
| Cash |
-58.3 |
|
| Other |
0.7 |
|
|
| Total |
100.0 |
|
|
|
|
|
Data through
2025-06-30 |
|
|
|
|
| Morningstar Fixed-Income Sectors |
|
| % Fund |
 |
Government |
40.35 |
 |
Corporate |
4.14 |
 |
Securitized |
20.48 |
 |
Municipal |
0.03 |
 |
Cash & Equivalents |
24.15 |
 |
Derivative |
10.84 |
|
|
|
% Bonds |
| AAA |
6.31 |
| AA |
65.56 |
| A |
3.82 |
| BBB |
14.42 |
| BB |
4.95 |
| B |
0.64 |
| Below B |
4.29 |
| Not Rated |
0.00 |
|
|
|
|
|
| Total Number of Stock Holdings |
1 |
| Total Number of Bond Holdings |
264 |
| % of Net Assets in Top 10 Holdings |
150.29 |
|
|
| Turnover % |
(as of 2024-12-31) |
947.00 |
| 30 Day SEC Yield % |
5.03 |
|
|
Maturity
Date
|
Shares
|
Value
$000
|
% of Net
Assets
|
 |
|
|
|
|
|
 |
5 Year Treasury Note Future Sept 25 |
2025-10-01 |
--- |
34,886 |
39.97 |
|
Federal National Mortgage Association 5% |
2055-08-13 |
24,500 |
23,998 |
27.50 |
 |
Pimco Fds |
2025-09-11 |
2,224 |
21,657 |
24.82 |
|
Federal National Mortgage Association 6% |
2055-08-13 |
14,200 |
14,417 |
16.52 |
 |
Ultra 10 Year US Treasury Note Future Sept 25 |
2025-09-20 |
--- |
-13,254 |
15.19 |
 |
|
2 Year Treasury Note Future Sept 25 |
2025-10-01 |
--- |
6,865 |
7.87 |
|
Ultra US Treasury Bond Future Sept 25 |
2025-09-20 |
--- |
-4,521 |
5.18 |
|
Federal National Mortgage Association 4% |
2055-07-14 |
4,300 |
3,999 |
4.58 |
|
10 Year Japanese Government Bond Future Sept 25 |
2025-09-13 |
--- |
-3,850 |
4.41 |
|
United States Treasury Notes 4.25% |
2034-11-15 |
3,700 |
3,713 |
4.25 |
|
|
 |
|
|
|
|
|
| Short Sale, Credit and Counterparty, Prepayment (Call), Currency, Emerging Markets, Foreign Securities, Loss of Money, Not FDIC Insured, High Portfolio Turnover, Issuer, Interest Rate, Market/Market Volatility, Equity Securities, High-Yield Securities, Mortgage-Backed and Asset-Backed Securities, Restricted/Illiquid Securities, Derivatives, Leverage, Sovereign Debt, Management |
|
| Show Risk Definitions |
|
|
| Inception Date: 2012-04-30 |
|
| Mohit Mittal (2022-01-01) |
|
| Mr. Mittal is CIO Core Strategies and a managing director based in the Newport Beach office. He is a member of the Investment Committee and a portfolio manager for fixed income multi-sector portfolios across the duration and credit spectrum. As CIO Core Strategies, Mr. Mittal has leadership and oversight responsibilities for long-only strategies across PIMCO's Low and Moderate Duration, Total Return, and Long Duration strategy suite. Morningstar named him winner of the 2020 U.S. Morningstar Award for Investing Excellence in the Rising Talent category. |
|
| Daniel J. Ivascyn (2014-09-26) |
|
| Mr. Ivascyn is Group Chief Investment Officer and a managing director in the Newport Beach office. He is lead portfolio manager for the firm’s income strategies and credit hedge fund and mortgage opportunistic strategies. Prior to joining PIMCO in 1998, he worked at Bear Stearns in the asset-backed securities group, as well as T. Rowe Price and Fidelity Investments. He holds an MBA in analytic finance from the University of Chicago Graduate School of Business and a bachelor's degree in economics from Occidental College. |
|
| Marc P. Seidner (2015-01-12) |
|
| Mr. Seidner is CIO Non-traditional Strategies, a managing director and head of portfolio management in the New York office. He is also a generalist portfolio manager and a member of the Investment Committee. He rejoined PIMCO in November 2014 after serving as head of fixed income at GMO LLC. Prior to joining PIMCO in 2009, he was a managing director and domestic fixed income portfolio manager at Harvard Management Company. Previously, he was director of active core strategies at Standish Mellon Asset Management. He holds an undergraduate degree in economics from Boston College. |
|
|
|
| Pacific Investment Management Company, LLC |
|
|
|
|
|
|
|
|

© Copyright 2025 Morningstar, Inc. All rights reserved. Morningstar, the Morningstar logo, Morningstar.com, Morningstar Tools are either trademark or service marks of Morningstar, Inc. The information contained herein: (1) is proprietary to Morningstar and/or its content providers; (2) may not be copied or distributed; and (3) is not warranted to be accurate, complete or timely. Neither Morningstar nor its content providers are responsible for any damages or any losses arising from any use of information. Past performance is no guarantee of future performance. |
|
Past performance is no guarantee of future results.
Returns will vary and shares may be worth more or less than their original cost when sold.
|
|