Morningstar® Investment Profile™   Morningstar®
Disclosure
  Format
for Print
Janus Henderson VIT Mid Cap Value Instl  JAMVX
Release date as of 2024-10-31. Data on page is subject to change.
Snapshot Ratings & Risk Portfolio Nuts & Bolts
  Morningstar Report
Overall Morningstar
Rating™
What is this?
As of 2024-10-31
Out of 373
Mid-Cap Value Funds
Morningstar®
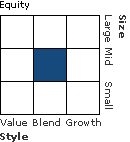
Style Box™
What is this?
As of 2024-08-31
Total Fund Assets ($ Mil)
121.35
View Historical Morningstar Star Ratings and Definitions
  Investment Objective & Strategy  
The investment seeks capital appreciation.
The Portfolio pursues its investment objective by investing primarily in the common stocks of mid-sized companies and focuses on companies whose stock prices are believed to be undervalued by portfolio management or that have fallen out of favor with the market. The Portfolio may invest up to 20% of its net assets in securities of companies having market capitalizations outside of the aforementioned market capitalization ranges.
  Morningstar Category: Mid-Cap Value
Some mid-cap value portfolios focus on medium-size companies while others land here because they own a mix of small-, mid-, and large-cap stocks. All look for U.S. stocks that are less expensive or growing more slowly than the market. Stocks in the middle 20% of the capitalization of the U.S. equity market are defined as mid-cap. Value is defined based on low valuations (low price ratios and high dividend yields) and slow growth (low growth rates for earnings, sales, book value, and cash flow). 
  Investment Risks
Mid Cap Funds: The securities of companies with market capitalizations below $10 billion may be more volatile and less liquid than the securities of larger companies.
  Portfolio Profile
Asset Allocation
% of Net Assets
Bullet U.S. Stocks U.S. Stocks 93.1
Bullet Non-U.S. Stocks Non-U.S. Stocks 4.0
Bullet Bonds Bonds 0.0
Bullet Cash Cash 2.9
Bullet Other Other 0.0
Asset Allocation Rescaled Graph
Data through 2024-08-31
Morningstar Equity Sectors
% of Stocks
Cyclical 46.17
Basic Materials 6.88
Consumer Cyclical 13.01
Financial Services 16.53
Real Estate 9.75
Sensitive 36.86
Communication Services 2.02
Energy 6.16
Industrials 20.00
Technology 8.68
Defensive 16.96
Consumer Defensive 3.45
Healthcare 8.11
Utilities 5.40
Data through 2024-08-31
Holding Status
Total Number of Stock Holdings 70
Total Number of Bond Holdings 0
% of Net Assets in Top 10 Holdings 22.25
Turnover % (as of 2023-12-31) 47.00
30 Day SEC Yield % 0.00
Top Holdings
Sector P/E % of Net
Assets
Entergy Corp 18.81 2.68
Alliant Energy Corp 24.49 2.56
Casey's General Stores Inc 28.68 2.53
Freeport-McMoRan Inc 32.62 2.20
Lamar Advertising Co Class A --- 2.17
Wintrust Financial Corp 12.15 2.05
The Hartford Financial Services Group Inc 11.09 2.04
Agree Realty Corp --- 2.03
Marathon Oil Corp 10.82 2.03
Fox Corp Class B 12.45 1.96
Data through 2024-08-31
  Principal Risks   
Foreign Securities, Long-Term Outlook and Projections, Loss of Money, Not FDIC Insured, Value Investing, Active Management, Market/Market Volatility, Equity Securities, IPO, Mid-Cap, Real Estate/REIT Sector
Show Risk Definitions
  Other Information
Inception Date: 2003-05-01
Portfolio Manager(s)
Kevin Preloger   (2013-04-30)
Kevin Preloger is a Portfolio Manager at Janus Henderson Investors and co-leads the SMID Value Team. Kevin joined the firm in 2002 as a research analyst covering the financial services sector. He became a portfolio manager in 2013. Prior to joining the firm, he worked as an analyst at ABN AMRO/LaSalle Bank Wealth Management and covered the financial services and technology sectors during his five-year tenure at the firm. Kevin received his bachelor of arts degree in economics from Northwestern University. He has 27 years of financial industry experience.
Justin Tugman   (2015-03-19)
Justin Tugman is a Portfolio Manager at Janus Henderson Investors and co-leads the SMID Value Team. Justin served as a research analyst through 2012, covering the energy and utility sectors upon joining the firm in 2004. Prior to that, he worked at Simmons & Company International as an analyst covering the energy sector during his four-year tenure at the firm. Justin received his bachelor of science degree in finance from the University of Wyoming and an MBA with a concentration in finance from Tulane University. He holds the Chartered Financial Analyst designation and has 24 years of financial industry experience.
Investment Advisor(s)
Janus Henderson Investors US LLC
Issuer
Janus Henderson
Subadvisor(s)
---
Show Data Definitions

© Copyright 2024 Morningstar, Inc.
All rights reserved. Morningstar, the Morningstar logo, Morningstar.com, Morningstar Tools are either trademark or service marks of Morningstar, Inc. The information contained herein: (1) is proprietary to Morningstar and/or its content providers; (2) may not be copied or distributed; and (3) is not warranted to be accurate, complete or timely. Neither Morningstar nor its content providers are responsible for any damages or any losses arising from any use of information. Past performance is no guarantee of future performance.
Past performance is no guarantee of future results.
Returns will vary and shares may be worth more or less than their original cost when sold.
 Symetra
Morningstar® Investment Profile™   Morningstar®
Disclosure
  Format
for Print
Janus Henderson VIT Mid Cap Value Instl  JAMVX
Release date as of 2024-10-31. Data on page is subject to change.
Snapshot Ratings & Risk Portfolio Nuts & Bolts
  Morningstar Ratings
Morningstar
Return
Morningstar
Risk
Morningstar
Rating
Number of
Funds
3-Year Above Avg Average 373
5-Year Below Avg Below Avg 361
10-Year Average Below Avg 290
Overall Average Below Avg 373
Morningstar Category: Mid-Cap Value | Number of Funds in Category: 373
Data through 2024-10-31
Ratings reflect risk-adjusted performance and are derived from a weighted average of the performance figures associated with its three, five and ten-year (if applicable) time periods.
  Volatility Measurements
Standard Deviation 18.12
Mean 7.79
Sharpe Ratio 0.29
Trailing 3-Yr as of 2024-10-31
  Modern Portfolio Theory Statistics
Best Fit Index
Russell Mid Cap Value TR USD
R-Squared 98
Beta 0.92
Alpha 2.51
Trailing 3-Yr as of 2024-10-31
  Principal Risks   
Foreign Securities, Long-Term Outlook and Projections, Loss of Money, Not FDIC Insured, Value Investing, Active Management, Market/Market Volatility, Equity Securities, IPO, Mid-Cap, Real Estate/REIT Sector
Show Risk Definitions
  Investment Risks
Mid Cap Funds: The securities of companies with market capitalizations below $10 billion may be more volatile and less liquid than the securities of larger companies.
Show Data Definitions

© Copyright 2024 Morningstar, Inc.
All rights reserved. Morningstar, the Morningstar logo, Morningstar.com, Morningstar Tools are either trademark or service marks of Morningstar, Inc. The information contained herein: (1) is proprietary to Morningstar and/or its content providers; (2) may not be copied or distributed; and (3) is not warranted to be accurate, complete or timely. Neither Morningstar nor its content providers are responsible for any damages or any losses arising from any use of information. Past performance is no guarantee of future performance.
Past performance is no guarantee of future results.
Returns will vary and shares may be worth more or less than their original cost when sold.
 Symetra
Morningstar® Investment Profile™   Morningstar®
Disclosure
  Format
for Print
Janus Henderson VIT Mid Cap Value Instl  JAMVX
Release date as of 2024-10-31. Data on page is subject to change.
Snapshot Ratings & Risk Portfolio Nuts & Bolts
  Style Box Details for Stock Holdings
Size
Average Mkt Cap $Mil 16,608
   
Market Capitalization % of Portfolio
Giant 3.08
Large 8.86
Medium 55.40
Small 32.00
Micro 0.66
   
Investment Valuation Stock
Portfolio
Forward P/E 17.7
Price/Book 2.2
Price/Sales 1.4
Price/Cash Flow 11.5
Dividend Yield 1.8
Long-Term Earnings 11.3
Historical Earnings 2.5
Sales Growth 9.2
Cash-Flow Growth 12.7
Book-Value Growth 6.0
As of 2024-08-31
Data as of 2024-08-31
  Asset Allocation
% of Net Assets
Bullet U.S. Stocks U.S. Stocks 93.1
Bullet Non-U.S. Stocks Non-U.S. Stocks 4.0
Bullet Bonds Bonds 0.0
Bullet Cash Cash 2.9
Bullet Other Other 0.0
Asset Allocation Rescaled Graph
Data through 2024-08-31
  Morningstar Equity Sectors
% of Stocks
Cyclical 46.17
Basic Materials 6.88
Consumer Cyclical 13.01
Financial Services 16.53
Real Estate 9.75
Sensitive 36.86
Communication Services 2.02
Energy 6.16
Industrials 20.00
Technology 8.68
Defensive 16.96
Consumer Defensive 3.45
Healthcare 8.11
Utilities 5.40
Data through 2024-08-31
  Top 25 Holdings
Total Number of Stock Holdings 70
Total Number of Bond Holdings 0
% of Net Assets in Top 10 Holdings 22.25
Turnover % (as of 2023-12-31) 47.00
30 Day SEC Yield % 0.00
Top 25 Holdings
Sector P/E % of Net
Assets
Entergy Corp 18.81 2.68
Alliant Energy Corp 24.49 2.56
Casey's General Stores Inc 28.68 2.53
Freeport-McMoRan Inc 32.62 2.20
Lamar Advertising Co Class A --- 2.17
Wintrust Financial Corp 12.15 2.05
The Hartford Financial Services Group Inc 11.09 2.04
Agree Realty Corp --- 2.03
Marathon Oil Corp 10.82 2.03
Fox Corp Class B 12.45 1.96
Expand Energy Corp Ordinary Shares - New 51.98 1.91
Lazard Inc 20.54 1.88
Fidelity National Information Services Inc 88.84 1.85
Waste Connections Inc --- 1.76
TransUnion 88.86 1.75
3M Co 13.37 1.73
Fortune Brands Innovations Inc 23.67 1.73
CBRE Group Inc Class A 42.39 1.72
Labcorp Holdings Inc 43.31 1.59
Vontier Corp Ordinary Shares 14.15 1.58
PNC Financial Services Group Inc 15.91 1.58
L3Harris Technologies Inc 39.11 1.56
AMETEK Inc 31.94 1.51
Ball Corp 24.69 1.51
Carlisle Companies Inc 22.65 1.46
Data through 2024-08-31
Show Data Definitions

© Copyright 2024 Morningstar, Inc.
All rights reserved. Morningstar, the Morningstar logo, Morningstar.com, Morningstar Tools are either trademark or service marks of Morningstar, Inc. The information contained herein: (1) is proprietary to Morningstar and/or its content providers; (2) may not be copied or distributed; and (3) is not warranted to be accurate, complete or timely. Neither Morningstar nor its content providers are responsible for any damages or any losses arising from any use of information. Past performance is no guarantee of future performance.
Past performance is no guarantee of future results.
Returns will vary and shares may be worth more or less than their original cost when sold.
 Symetra
Morningstar® Investment Profile™   Morningstar®
Disclosure
  Format
for Print
Janus Henderson VIT Mid Cap Value Instl  JAMVX
Release date as of 2024-10-31. Data on page is subject to change.
Snapshot Ratings & Risk Portfolio Nuts & Bolts
  Fees and Expenses Taken from prospectus dated 2024-04-29  
Maximum Fees
Administrative 0.05%
Management 0.51%
12b-1 ---
Actual Fees
12b-1 ---
Management 0.50%
Expense Ratio 0.90%
(taken from annual report dated 2024-06-30)
Total Annual Operating Expense 0.69%
Waiver Data
Type Date %
ExpenseRatio Contractual 2025-04-29 0.01
  Management
Inception Date: 2003-05-01
Mngr Name Kevin Preloger
Mngr Start Date 2013-04-30
Biography
Kevin Preloger is a Portfolio Manager at Janus Henderson Investors and co-leads the SMID Value Team. Kevin joined the firm in 2002 as a research analyst covering the financial services sector. He became a portfolio manager in 2013. Prior to joining the firm, he worked as an analyst at ABN AMRO/LaSalle Bank Wealth Management and covered the financial services and technology sectors during his five-year tenure at the firm. Kevin received his bachelor of arts degree in economics from Northwestern University. He has 27 years of financial industry experience.
Mngr Name Justin Tugman
Mngr Start Date 2015-03-19
Biography
Justin Tugman is a Portfolio Manager at Janus Henderson Investors and co-leads the SMID Value Team. Justin served as a research analyst through 2012, covering the energy and utility sectors upon joining the firm in 2004. Prior to that, he worked at Simmons & Company International as an analyst covering the energy sector during his four-year tenure at the firm. Justin received his bachelor of science degree in finance from the University of Wyoming and an MBA with a concentration in finance from Tulane University. He holds the Chartered Financial Analyst designation and has 24 years of financial industry experience.
Investment Advisor(s)
Janus Henderson Investors US LLC
Web Site
www.janus.com
Issuer
Janus Henderson
Subadvisor(s)
---
Show Data Definitions

© Copyright 2024 Morningstar, Inc.
All rights reserved. Morningstar, the Morningstar logo, Morningstar.com, Morningstar Tools are either trademark or service marks of Morningstar, Inc. The information contained herein: (1) is proprietary to Morningstar and/or its content providers; (2) may not be copied or distributed; and (3) is not warranted to be accurate, complete or timely. Neither Morningstar nor its content providers are responsible for any damages or any losses arising from any use of information. Past performance is no guarantee of future performance.
Past performance is no guarantee of future results.
Returns will vary and shares may be worth more or less than their original cost when sold.

Morningstar Investment Profilessm: Disclosure Statement
Morningstar Rating, Risk and Return
The Morningstar RatingTM for funds, or "star rating", is calculated for managed products (including mutual funds, variable annuity and variable life subaccounts, exchange-traded funds, closed-end funds, and separate accounts) with at least a three-year history. Exchange-traded funds and open-ended mutual funds are considered a single population for comparative purposes. It is calculated based on a Morningstar Risk-Adjusted Return measure that accounts for variation in a managed product's monthly excess performance, placing more emphasis on downward variations and rewarding consistent performance. The Morningstar Rating does not include any adjustment for sales loads. The top 10% of products in each product category receive 5 stars, the next 22.5% receive 4 stars, the next 35% receive 3 stars, the next 22.5% receive 2 stars, and the bottom 10% receive 1 star. The Overall Morningstar Rating for a managed product is derived from a weighted average of the performance figures associated with its three-, five-, and 10-year (if applicable) Morningstar Rating metrics. The weights are: 100% three-year rating for 36-59 months of total returns, 60% five-year rating/40% three-year rating for 60-119 months of total returns, and 50% 10-year rating/30% five-year rating/20% three-year rating for 120 or more months of total returns. While the 10-year overall star rating formula seems to give the most weight to the 10-year period, the most recent three-year period actually has the greatest impact because it is included in all three rating periods.
For private funds, the Morningstar Rating presented is hypothetical, because Morningstar does not independently analyze private funds. Rather, the rating is assigned as a means to compare these funds with the universe of mutual funds that Morningstar rates. The evaluation of this investment does not affect the retail mutual fund data published by Morningstar.
Overall ratings represent a weighted average of specific time period (3-, 5- and 10-year) ratings.
The Morningstar Return rates a fund's performance relative to other managed products in its Morningstar Category. It is an assessment of a product's excess return over a risk-free rate (the return of the 90-day Treasury Bill) in comparison with the products in its Morningstar category. In each Morningstar category, the top 10% of products earn a High Morningstar Return (High), the next 22.5% Above Average (+Avg), the middle 35% Average (Avg), the next 22.5% Below Average (-Avg), and the bottom 10% Low (Low). Morningstar Return is measured for up to three time periods (three, five, and 10 years). These separate measures are then weighted and averaged to produce an overall measure for the product. Products with less than three years of performance history are not rated.
Morningstar Risk evaluates a fund's downside volatility relative to that of other products in its Morningstar Category. It is an assessment of the variations in monthly returns, with an emphasis on downside variations, in comparison with the products in its Morningstar category. In each Morningstar category, the 10% of products with the lowest measured risk are described as Low Risk (Low), the next 22.5% Below Average (-Avg), the middle 35% Average (Avg), the next 22.5% Above Average (+Avg), and the top 10% High (High). Morningstar Risk is measured for up to three time periods (three, five, and 10 years). These separate measures are then weighted and averaged to produce an overall measure for the product. Products with less than three years of performance history are not rated.
Janus Henderson VIT Mid Cap Value Instl
Morningstar Ratings (Relative to Category)
  Morningstar ReturnMorningstar RiskMorningstar Rating# of Funds
3-year Above AvgAverage373
5-year Below AvgBelow Avg361
10-year AverageBelow Avg290
Overall AverageBelow Avg373
Morningstar Category : Mid-Cap Value | Number of Funds in Category: 373
Data through 2024-10-31
Risk Measures
R-squared reflects the percentage of an investment option's movements that are explained by movements in its benchmark index, showing the degree of correlation between the investment option and the benchmark.
Beta is a measure of an investment option's sensitivity to market movements. A portfolio with a beta greater than 1 is more volatile than the market, and a portfolio with a beta less than 1 is less volatile than the market. Alpha measures the difference between an investment option's actual returns and its expected performance, given its level of risk (as measured by beta).
The Sharpe ratio uses standard deviation and excess return to determine reward per unit of risk.
Standard deviation is a statistical measure of the volatility of the investment option's returns.
Mean represents the annualized three-year geometric return.
Morningstar Style BoxTM
The Morningstar Style Box reveals a fund's investment strategy as of the date noted on this report.
For equity funds, the vertical axis shows the market capitalization of the long stocks owned, and the horizontal axis shows the investment style (value, blend, or growth). A darkened cell in the style box matrix indicates the weighted average style of the portfolio.
For portfolios holding fixed-income investments, a Fixed Income Style Box is calculated. The vertical axis shows the credit quality based on credit ratings and the horizontal axis shows interest-rate sensitivity as measured by effective duration. There are three credit categories - "High", "Medium", and "Low"; and there are three interest rate sensitivity categories - "Limited", "Moderate", and "Extensive"; resulting in nine possible combinations. As in the Equity Style Box, the combination of credit and interest rate sensitivity for a portfolio is represented by a darkened square in the matrix. Morningstar uses credit rating information from credit rating agencies (CRAs) that have been designated Nationally Recognized Statistical Rating Organizations (NRSROs) by the Securities and Exchange Commission (SEC) in the United States. For a list of all NRSROs, please visit https://www.sec.gov/ocr/ocr-current-nrsros.html. Additionally, Morningstar will use credit ratings from CRAs which have been recognized by foreign regulatory institutions that are deemed the equivalent of the NRSRO designation. To determine the rating applicable to a holding and the subsequent holding weighted value of a portfolio two methods may be employed. First is a common methodology approach where if a case exists such that two CRAs have rated a holding, the lower rating of the two should be applied; if three or more CRAs have rated a holding, the median rating should be applied; and in cases where there are more than two ratings and a median rating cannot be determined, the lower of the two middle ratings should be applied. Alternatively, if there is more than one rating available an average can be calculated from all and applied. Please Note: Morningstar, Inc. is not an NRSRO nor does it issue a credit rating on the fund. Credit ratings for any security held in a portfolio can change over time.
Morningstar uses the credit rating information to calculate a weighted-average credit quality value for the portfolio. This value is based only upon those holdings which are considered to be classified as "fixed income", such a government, corporate, or securitized issues. Other types of holdings such as equities and many, though not all, types of derivatives are excluded. The weighted-average credit quality value is represented by a rating symbol which corresponds to the long-term rating symbol schemas employed by most CRAs. Note that this value is not explicitly published but instead serves as an input in the Style Box calculation. This symbol is then used to map to a Style Box credit quality category of "low," "medium," or "high". Funds with a "low" credit quality category are those whose weighted-average credit quality is determined to be equivalent to the commonly used High Yield classification, meaning a rating below "BBB", portfolios assigned to the "high" credit category have either a "AAA" or "AA+" average credit quality value, while "medium" are those with an average rating of "AA-" inclusive to "BBB-". It is expected and intended that the majority of portfolios will be assigned a credit category of "medium".
For assignment to an interest-rate sensitivity category, Morningstar uses the average effective duration of the portfolio. From this value there are three distinct methodologies employed to determine assignment to category. Portfolio which are assigned to Morningstar municipal-bond categories employ static breakpoints between categories. These breakpoints are: "Limited" equal to 4.5 years or less, "Moderate" equal to 4.5 years to less than 7 years; and "Extensive" equal to more than 7 years. For portfolios assigned to Morningstar categories other than U.S. Taxable, including all domiciled outside the United States, static duration breakpoints are also used: "Limited" equals less than or equal to 3.5 years, "Moderate" equals greater than 3.5 years but less than or equal to 6 years, and "Extensive" is assigned to portfolios with effective durations of more than 6 years.
Note: Interest-rate sensitivity for non-U.S. domiciled portfolios (excluding those in Morningstar convertible categories) may be assigned using average modified duration when average effective duration is not available.
For portfolios Morningstar classifies as U.S. Taxable Fixed-Income, interest-rate sensitivity category assignment is based on the effective duration of the Morningstar Core Bond Index (MCBI). The classification assignment is dynamically determined relative to the benchmark index value. A "Limited" category will be assigned to portfolios whose average effective duration is between 25% to 75% of MCBI average effective duration, where the average effective duration is between 75% to 125% of the MCBI the portfolio will be classified as "Moderate", and those portfolios with an average effective duration value 125% or greater of the average effective duration of the MCBI will be classified as "Extensive".
Investment Risk
Foreign Securities Investment Options:/Emerging Market Investment Options: The investor should note that investment options that invest in foreign securities involve special additional risks. These risks include, but are not limited to, currency risk, political risk, and risk associated with varying accounting standards. Investing in emerging markets may accentuate these risks.
Sector Investment Options: The investor should note that investment options that invest exclusively in one sector or industry involve additional risks. The lack of industry diversification subjects the investor to increased industry-specific risks.
Non-Diversified Investment Options: The investor should note that investment options that invest more of their assets in a single issuer involve additional risks, including share price fluctuations, because of the increased concentration of investments.
Small Cap Investment Options: The investor should note that investment options that invest in stocks of small companies involve additional risks. Smaller companies typically have a higher risk of failure, and are not as well established as larger blue-chip companies. Historically, smaller-company stocks have experienced a greater degree of market volatility than the overall market average.
Mid Cap Investment Options: The investor should note that investment options that invest in companies with market capitalizations below $10 billion involve additional risks. The securities of these companies may be more volatile and less liquid than the securities of larger companies.
High-Yield Bond Investment Options: The investor should note that investment options that invest in lower-rated debt securities (commonly referred to as junk bonds) involve additional risks because of the lower credit quality of the securities in the portfolio. The investor should be aware of the possible higher level of volatility, and increased risk of default.
Yield
The yield of an investment option refers to the income generated by an investment in that investment option over an identified period of time. The SEC 30-day yield refers to the income generated by an investment over an identified 30-day period. The SEC 30-day yield is calculated by dividing: (I) the net investment income per share of the investment option earned over a 30-day period; by (II) the maximum offering price per share of the investment option on the last day of the period. This number is then annualized using semi-annual compounding. This means that the amount of income generated during the 30-day period is assumed to be generated each month over a 12-month period and is reinvested every six months. The yield does not necessarily reflect income actually earned by investing in the investment option because of certain adjustments required by the SEC and, therefore, may not correlate to the dividends or other distributions paid to shareholders.