| Morningstar Agrsv Gr ETF Asset Allc II AGTFX |
|
 |
|
| Release date as of 2025-08-31. Data on page is subject to change. |
|
|
Overall Morningstar
Rating™
|
| What is this?
|
|
 |
| As of 2025-08-31 |
|
Out of 128
Global Aggressive Allocation Funds
|
|
|
|
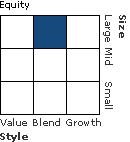
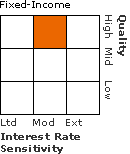
Morningstar®
Style Box™
|
| What is this?
|
|
 |
|
| As of 2025-07-31 |
|
 |
|
| As of 2025-07-31 |
|
|
| Total Fund Assets ($ Mil) |
| 60.41 |
|
|
|
| Investment Objective & Strategy |
|
| The investment seeks capital appreciation.
|
|
| The fund normally invests at least 80% of its net assets plus the amount of any borrowings for investment purposes, in securities of exchange-traded funds. The advisor typically expects to allocate its investments in ETFs such that 5% of such allocation is invested in ETFs that invest primarily in fixed-income securities and money market instruments and approximately 95% of such allocation is invested in ETFs that invest primarily in equity securities of large, medium and small sized companies, and may include other investments such as commodities and commodity futures. |
|
|
| Morningstar Category: Global Aggressive Allocation |
|
| Funds in allocation categories seek to provide both income and capital appreciation by primarily investing in multiple asset classes, including stocks, bonds, and cash. These aggressive strategies typically prioritize capital appreciation over preservation. They typically expect volatility similar to a strategic equity exposure of more than 85%. Funds in this global category are generally expected to have no more than 75% of their assets in US securities.
|
|
|
| Fund of Funds: An investment option with mutual funds in its portfolio may be subject to the expenses of those mutual funds in addition to those of the investment option itself. |
|
|
| % of Net Assets |
 |
U.S. Stocks |
64.7 |
 |
Non-U.S. Stocks |
29.5 |
 |
Bonds |
4.0 |
 |
Cash |
1.8 |
 |
Other |
0.0 |
|
|
 |
| Data through 2025-07-31 |
|
|
|
|
| Morningstar Equity Sectors |
|
|
|
% of Stocks |
 |
Cyclical |
33.54 |
 |
Basic Materials |
3.66 |
 |
Consumer Cyclical |
11.02 |
 |
Financial Services |
16.03 |
 |
Real Estate |
2.83 |
|
|
|
 |
Sensitive |
50.32 |
 |
Communication Services |
7.80 |
 |
Energy |
3.87 |
 |
Industrials |
11.98 |
 |
Technology |
26.67 |
|
|
|
 |
Defensive |
16.13 |
 |
Consumer Defensive |
5.29 |
 |
Healthcare |
8.28 |
 |
Utilities |
2.56 |
|
| Data through 2025-07-31 |
|
|
|
| Morningstar Fixed-Income Sectors |
|
| % Fund |
 |
Government |
35.75 |
 |
Corporate |
36.44 |
 |
Securitized |
14.97 |
 |
Municipal |
0.32 |
 |
Cash & Equivalents |
12.27 |
 |
Derivative |
0.26 |
|
|
|
% Bonds |
| AAA |
72.23 |
| AA |
3.20 |
| A |
11.88 |
| BBB |
12.71 |
| BB |
0.00 |
| B |
0.00 |
| Below B |
0.00 |
| Not Rated |
-0.02 |
|
|
|
|
|
| Total Number of Stock Holdings |
0 |
| Total Number of Bond Holdings |
0 |
| % of Net Assets in Top 10 Holdings |
96.50 |
|
|
| Turnover % |
(as of 2024-12-31) |
35.00 |
| 30 Day SEC Yield % |
--- |
|
|
Sector |
Country |
Maturity Date |
Market Value ($000) |
% of Net Assets |
|
| Vanguard Total Stock Market ETF |
--- |
USA |
--- |
53,929 |
25.25 |
| iShares Core S&P 500 ETF |
--- |
USA |
--- |
34,537 |
16.17 |
| Vanguard FTSE Developed Markets ETF |
--- |
USA |
--- |
29,218 |
13.68 |
| Vanguard Small-Cap ETF |
--- |
USA |
--- |
16,881 |
7.90 |
| Schwab Fundamental International Eq ETF |
--- |
USA |
--- |
16,862 |
7.89 |
 |
| iShares S&P 100 ETF |
--- |
USA |
--- |
14,283 |
6.69 |
| Vanguard FTSE Emerging Markets ETF |
--- |
USA |
--- |
12,579 |
5.89 |
| iShares Core S&P Mid-Cap ETF |
--- |
USA |
--- |
10,482 |
4.91 |
| Vanguard Mega Cap Growth ETF |
--- |
USA |
--- |
8,876 |
4.16 |
| Vanguard Total Bond Market ETF |
--- |
USA |
--- |
8,456 |
3.96 |
 |
|
 |
|
|
|
|
|
| Foreign Securities, Loss of Money, Not FDIC Insured, Market/Market Volatility, Equity Securities, ETF, Industry and Sector Investing, Underlying Fund/Fund of Funds, Fixed-Income Securities, Conflict of Interest, Management |
|
| Show Risk Definitions |
|
|
| Inception Date: 2007-04-30 |
|
| Jared Watts (2007-04-30) |
|
| Jared Watts, Portfolio Manager. Mr. Watts joined Morningstar Investment Management in 2006. His responsibilities include the management of fund-of-funds clients across multiple financial intermediary segments. Mr. Watts helps develop and manage multiple asset allocation solutions and strategies. In addition to conducting fund research, Mr. Watts helps lead the research and implementation efforts on exchange-traded products for Morningstar’s Investment Management group. Prior to joining Morningstar, Mr. Watts was an Investment Manager at Allstate Financial, where he helped manage fund relationships, asset allocation efforts, and investment product research. Prior to Allstate, Mr. Watts was at A.G. Edwards, where he conducted mutual fund and stock research. Mr. Watts holds a bachelor’s degree in finance from Southern Illinois University and a master’s degree in business administration, with honors, from Saint Xavier University, Graham School of Management with concentrations in portfolio management and financial analysis. |
|
| Steve Tagarov (2019-12-18) |
|
| Steve Tagarov, CFA, Senior Investment Analyst: Mr. Tagarov joined Morningstar Investment Management in 2015. His responsibilities include supporting Target Risk Strategies, conducting manager research, manager due diligence, and he is a member of the Global Sectors team. Mr. Tagarov started his investment career since 2006. Prior to joining Morningstar Investment Management, Mr. Tagarov was a Senior Investment Consultant at Aon Hewitt Investment Consulting. Mr. Tagarov is a chartered financial analyst, he holds a bachelor’s degree from Augustana College and he’s currently an MBA candidate at the University of Chicago Booth school of business. |
|
|
|
|
|
|
|
|
|
| Morningstar Investment Management LLC |
|
|

© Copyright 2025 Morningstar, Inc. All rights reserved. Morningstar, the Morningstar logo, Morningstar.com, Morningstar Tools are either trademark or service marks of Morningstar, Inc. The information contained herein: (1) is proprietary to Morningstar and/or its content providers; (2) may not be copied or distributed; and (3) is not warranted to be accurate, complete or timely. Neither Morningstar nor its content providers are responsible for any damages or any losses arising from any use of information. Past performance is no guarantee of future performance. |
|
Past performance is no guarantee of future results.
Returns will vary and shares may be worth more or less than their original cost when sold.
|
|


