|
| Release date as of 2025-09-30. Data on page is subject to change. |
|
|
Overall Morningstar
Rating™
|
| What is this?
|
|
 |
| As of 2025-09-30 |
|
Out of 217
Moderately Conservative Allocation Funds
|
|
|
|
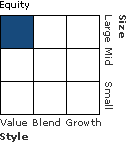
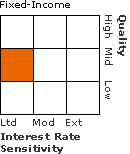
Morningstar®
Style Box™
|
| What is this?
|
|
 |
|
| As of 2025-08-31 |
|
 |
|
| As of 2025-08-31 |
|
|
| Total Fund Assets ($ Mil) |
| 3,227.71 |
|
|
|
| Investment Objective & Strategy |
|
| The investment seeks to maximize income while maintaining prospects for capital appreciation.
|
|
| The fund invests in a diversified portfolio of debt and equity securities. It may shift its investments from one asset class to another based on the investment manager's analysis of the best opportunities for the fund's portfolio in a given market. The fund may invest up to 100% of its total assets in debt securities that are rated below investment grade (also known as "junk bonds"), including a portion in defaulted securities. It may also invest up to 25% of its assets in foreign securities, either directly or through depositary receipts. |
|
|
| Morningstar Category: Moderately Conservative Allocation |
|
| Funds in allocation categories seek to provide both income and capital appreciation by primarily investing in multiple asset classes, including stocks, bonds, and cash. These moderately conservative strategies prioritize preservation of capital over appreciation. They typically expect volatility similar to a strategic equity exposure between 30% and 50%.
|
|
|
| There are no additional fund specific investment risks (e.g. liquidity risk, currency risk, foreign investment risk, etc.) associated with this fund beyond the normal risks generally associated with investing in a mutual fund. |
|
|
| % of Net Assets |
 |
U.S. Stocks |
31.0 |
 |
Non-U.S. Stocks |
4.2 |
 |
Bonds |
49.2 |
 |
Cash |
2.7 |
 |
Other |
13.0 |
|
|
 |
| Data through 2025-08-31 |
|
|
|
|
| Morningstar Equity Sectors |
|
|
|
% of Stocks |
 |
Cyclical |
17.29 |
 |
Basic Materials |
4.91 |
 |
Consumer Cyclical |
3.91 |
 |
Financial Services |
8.47 |
 |
Real Estate |
0.00 |
|
|
|
 |
Sensitive |
36.76 |
 |
Communication Services |
2.30 |
 |
Energy |
16.11 |
 |
Industrials |
10.35 |
 |
Technology |
8.00 |
|
|
|
 |
Defensive |
45.93 |
 |
Consumer Defensive |
13.82 |
 |
Healthcare |
19.14 |
 |
Utilities |
12.97 |
|
| Data through 2025-08-31 |
|
|
|
| Morningstar Fixed-Income Sectors |
|
| % Fund |
 |
Government |
9.12 |
 |
Corporate |
78.41 |
 |
Securitized |
10.31 |
 |
Municipal |
0.00 |
 |
Cash & Equivalents |
2.16 |
 |
Derivative |
0.00 |
|
|
|
% Bonds |
| AAA |
0.00 |
| AA |
25.83 |
| A |
7.31 |
| BBB |
18.78 |
| BB |
23.66 |
| B |
15.30 |
| Below B |
8.44 |
| Not Rated |
0.69 |
|
|
|
|
|
| Total Number of Stock Holdings |
57 |
| Total Number of Bond Holdings |
181 |
| % of Net Assets in Top 10 Holdings |
14.18 |
|
|
| Turnover % |
(as of 2023-12-31) |
34.98 |
| 30 Day SEC Yield % |
3.55 |
|
|
Sector |
Country |
Maturity Date |
Market Value ($000) |
% of Net Assets |
|
| Johnson & Johnson |
 |
USA |
--- |
62,010 |
1.94 |
| Chevron Corp |
 |
USA |
--- |
56,210 |
1.76 |
| Exxon Mobil Corp |
 |
USA |
--- |
54,288 |
1.70 |
| PepsiCo Inc |
 |
USA |
--- |
52,028 |
1.63 |
| Merck & Co Inc |
 |
USA |
--- |
42,060 |
1.31 |
 |
| Cisco Systems Inc |
 |
USA |
--- |
41,454 |
1.30 |
| Procter & Gamble Co |
 |
USA |
--- |
39,260 |
1.23 |
| NextEra Energy Inc |
 |
USA |
--- |
38,719 |
1.21 |
| United States Treasury Bonds 3.625% |
--- |
USA |
2053-05-15 |
33,993 |
1.06 |
| Southern Co |
 |
USA |
--- |
33,228 |
1.04 |
 |
|
 |
|
|
|
|
|
| Credit and Counterparty, Prepayment (Call), Foreign Securities, Loss of Money, Not FDIC Insured, Value Investing, Active Management, Income, Interest Rate, Market/Market Volatility, Convertible Securities, Depositary Receipts, High-Yield Securities, Mortgage-Backed and Asset-Backed Securities, Other, Derivatives, Portfolio Diversification, Structured Products |
|
| Show Risk Definitions |
|
|
| Inception Date: 1989-01-24 |
|
| Edward D. Perks (2002-03-01) |
|
| Edward Perks is chief investment officer of Franklin Templeton Investment Solutions and president of Franklin Advisers, Inc. In this role, Mr. Perks has oversight of myriad multi-asset investment capabilities designed to meet client needs for specific investment solutions. Mr. Perks joined Franklin Templeton in 1992. Mr. Perks holds a B.A. in economics and political science from Yale University. He is a Chartered Financial Analyst (CFA) charterholder, a member of the CFA Institute, and the Security Analysts of San Francisco (SASF). |
|
| Todd Brighton (2017-03-01) |
|
| Todd Brighton is a vice president, portfolio manager and research analyst for Franklin Templeton Multi-Asset Solutions. He is the lead manager of the Franklin Liberty US Low Volatility ETF. Mr. Brighton analyzes equity and equity-linked investments for the Core/Hybrid team and specializes in the development of volatility-based strategies. Mr. Brighton joined Franklin Templeton in 2000. He is a Chartered Financial Analyst (CFA) charterholder and a member of the CFA Institute and the CFA Society of San Francisco. |
|
| Brendan Circle (2019-02-01) |
|
| Brendan Circle is a vice president, portfolio manager, and research analyst for Franklin Templeton Multi-Asset Solutions. In this role, Mr. Circle serves as a comanager of Franklin Income Fund and related portfolios, as well as Franklin Managed Income Fund. He also specializes in analyzing investment opportunities across the fixed income markets for the Multi-Asset Solutions team. Mr. Circle joined Franklin Templeton in 2014. Mr. Circle is a Chartered Financial Analyst (CFA) Charterholder, as well as a member of the CFA Institute and the CFA Society of San Francisco. |
|
|
|
|
|
|
| Franklin Templeton Investments |
|
|
|
|
|

© Copyright 2025 Morningstar, Inc. All rights reserved. Morningstar, the Morningstar logo, Morningstar.com, Morningstar Tools are either trademark or service marks of Morningstar, Inc. The information contained herein: (1) is proprietary to Morningstar and/or its content providers; (2) may not be copied or distributed; and (3) is not warranted to be accurate, complete or timely. Neither Morningstar nor its content providers are responsible for any damages or any losses arising from any use of information. Past performance is no guarantee of future performance. |
|
Past performance is no guarantee of future results.
Returns will vary and shares may be worth more or less than their original cost when sold.
|
|


