| Invesco VI EQV International Equity I |
|
 |
|
| Release date as of 2025-09-30. Data on page is subject to change. |
|
|
| Style Box Details for Stock Holdings |
|
| Size |
|
| Average Mkt Cap $Mil |
67,979 |
|
|
|
| Market Capitalization |
% of Portfolio |
| Giant |
58.65 |
| Large |
32.92 |
| Medium |
8.43 |
| Small |
0.00 |
| Micro |
0.00 |
| |
|
|
| Trailing Valuations |
Stock
Portfolio
|
| Price/Book |
2.4 |
| Price/Earnings |
18.9 |
| Price/Cash Flow |
12.7 |
|
|
|
 |
|
| As of 2025-08-31 |
|
|
|
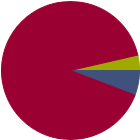
| % of Net Assets |
 |
U.S. Stocks |
5.8 |
 |
Non-U.S. Stocks |
90.6 |
 |
Bonds |
0.0 |
 |
Cash |
3.6 |
 |
Other |
0.0 |
|
|
 |
| Data through 2025-08-31 |
|
|
|
| Morningstar Equity Sectors |
|
|
|
% of Stocks |
 |
Cyclical |
37.37 |
 |
Basic Materials |
5.14 |
 |
Consumer Cyclical |
7.07 |
 |
Financial Services |
25.16 |
 |
Real Estate |
0.00 |
|
|
|
 |
Sensitive |
46.94 |
 |
Communication Services |
5.22 |
 |
Energy |
2.38 |
 |
Industrials |
19.97 |
 |
Technology |
19.37 |
|
|
|
 |
Defensive |
15.70 |
 |
Consumer Defensive |
5.38 |
 |
Healthcare |
10.32 |
 |
Utilities |
0.00 |
|
| Data through 2025-08-31 |
|
|
| Morningstar World Regions |
|
| % Fund |
| Americas |
17.2 |
|
| North America |
13.0 |
| Latin America |
4.3 |
|
| Greater Europe |
42.4 |
|
| United Kingdom |
10.6 |
| Europe Developed |
31.2 |
| Europe Emerging |
0.0 |
| Africa/Middle East |
0.6 |
|
| Greater Asia |
40.3 |
|
| Japan |
10.9 |
| Australasia |
2.2 |
| Asia Developed |
15.2 |
| Asia Emerging |
12.1 |
|
| Data through 2025-08-31 |
|
|
|
|
| Total Number of Stock Holdings |
84 |
| Total Number of Bond Holdings |
0 |
| % of Net Assets in Top 10 Holdings |
23.34 |
|
|
| Turnover % |
(as of 2024-12-31) |
31.00 |
| 30 Day SEC Yield % |
--- |
|
|
Sector |
Country |
% of Net
Assets
|
 |
|
|
|
|
|
Taiwan Semiconductor Manufacturing Co Ltd ADR |
|
Taiwan |
4.01 |
|
Investor AB Class B |
|
Sweden |
3.38 |
|
RB Global Inc |
|
Canada |
2.32 |
|
FinecoBank SpA |
|
Italy |
2.24 |
|
Legrand SA |
|
France |
1.94 |
 |
 |
BAE Systems PLC |
|
United Kingdom |
1.92 |
 |
HDFC Bank Ltd ADR |
|
India |
1.90 |
|
Invesco Shrt-Trm Inv Treasury Instl |
--- |
United States |
1.88 |
|
Techtronic Industries Co Ltd |
|
Hong Kong |
1.88 |
|
Barclays PLC |
|
United Kingdom |
1.87 |
|
|
Keyence Corp |
|
Japan |
1.86 |
|
Air Liquide SA |
|
France |
1.82 |
|
Sony Group Corp |
|
Japan |
1.73 |
|
AstraZeneca PLC |
|
United Kingdom |
1.58 |
|
Allianz SE |
|
Germany |
1.57 |
|
|
Hoya Corp |
|
Japan |
1.56 |
|
Icon PLC |
|
United States |
1.56 |
|
Trip Com Grp |
--- |
Cayman Islands |
1.56 |
|
MediaTek Inc |
|
Taiwan |
1.54 |
|
RELX PLC |
|
United Kingdom |
1.47 |
|
|
Schneider Electric SE |
|
France |
1.46 |
|
Haleon PLC |
|
United Kingdom |
1.46 |
|
AIA Group Ltd |
|
Hong Kong |
1.44 |
 |
E Ink Holdings Inc |
|
Taiwan |
1.39 |
|
Linde PLC |
|
United States |
1.37 |
|
|
 |
|
|

© Copyright 2025 Morningstar, Inc. All rights reserved. Morningstar, the Morningstar logo, Morningstar.com, Morningstar Tools are either trademark or service marks of Morningstar, Inc. The information contained herein: (1) is proprietary to Morningstar and/or its content providers; (2) may not be copied or distributed; and (3) is not warranted to be accurate, complete or timely. Neither Morningstar nor its content providers are responsible for any damages or any losses arising from any use of information. Past performance is no guarantee of future performance. |
|
Past performance is no guarantee of future results.
Returns will vary and shares may be worth more or less than their original cost when sold.
|
|

