| Royce Capital Small-Cap Inv |
|
 |
|
| Release date as of 2025-09-30. Data on page is subject to change. |
|
|
Overall Morningstar
Rating™
|
| What is this?
|
|
 |
| As of 2025-09-30 |
|
Out of 462
Small Value Funds
|
|
|
|
|
|
| Total Fund Assets ($ Mil) |
| 273.93 |
|
|
|
| Investment Objective & Strategy |
|
| The investment seeks long-term growth of capital.
|
|
| The fund invests the fund's assets primarily in equity securities of small-cap companies that Royce believes are trading below its estimate of their current worth. It generally invests in such companies that the advisor believes also possess financial strength, a strong business model, and the ability to generate and effectively allocate excess free cash flow. |
|
|
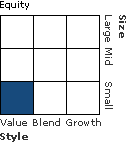
| Morningstar Category: Small Value |
|
| Small-value portfolios invest in small U.S. companies with valuations and growth rates below other small-cap peers. Stocks in the bottom 10% of the capitalization of the U.S. equity market are defined as small cap. Value is defined based on low valuations (low price ratios and high dividend yields) and slow growth (low growth rates for earnings, sales, book value, and cash flow).
|
|
|
| Small Cap Funds: Smaller companies typically have higher risk of failure, and are not as well established as larger blue-chip companies. Historically, the smaller company stocks have experienced a greater degree of market volatility than the overall market average. |
|
|
| % of Net Assets |
 |
U.S. Stocks |
93.4 |
 |
Non-U.S. Stocks |
1.6 |
 |
Bonds |
0.0 |
 |
Cash |
5.0 |
 |
Other |
0.0 |
|
|
 |
| Data through 2025-09-30 |
|
|
|
|
| Morningstar Equity Sectors |
|
|
|
% of Stocks |
 |
Cyclical |
56.23 |
 |
Basic Materials |
5.68 |
 |
Consumer Cyclical |
25.76 |
 |
Financial Services |
23.68 |
 |
Real Estate |
1.11 |
|
|
|
 |
Sensitive |
33.42 |
 |
Communication Services |
0.30 |
 |
Energy |
8.30 |
 |
Industrials |
8.65 |
 |
Technology |
16.17 |
|
|
|
 |
Defensive |
10.36 |
 |
Consumer Defensive |
1.93 |
 |
Healthcare |
7.90 |
 |
Utilities |
0.53 |
|
| Data through 2025-09-30 |
|
|
| Total Number of Stock Holdings |
82 |
| Total Number of Bond Holdings |
0 |
| % of Net Assets in Top 10 Holdings |
21.41 |
|
|
| Turnover % |
(as of 2024-12-31) |
36.00 |
| 30 Day SEC Yield % |
--- |
|
|
Sector |
P/E |
% of Net
Assets
|
 |
 |
 |
 |
 |
 |
iShares Russell 2000 Value ETF |
--- |
--- |
4.75 |
 |
Vanguard Small-Cap Value ETF |
--- |
--- |
3.14 |
 |
IBEX Ltd |
 |
15.95 |
1.81 |
 |
Buckle Inc |
 |
13.45 |
1.75 |
 |
PulteGroup Inc |
 |
9.19 |
1.74 |
 |
 |
TD Synnex Corp |
 |
16.90 |
1.73 |
 |
Visteon Corp |
 |
9.45 |
1.72 |
 |
M/I Homes Inc |
 |
7.41 |
1.65 |
 |
Diebold Nixdorf Inc Ordinary Shares- New |
 |
--- |
1.59 |
 |
Teekay Tankers Ltd Class A |
 |
6.31 |
1.53 |
 |
|
 |
|
|
|
|
|
| Foreign Securities, Loss of Money, Not FDIC Insured, Equity Securities, Industry and Sector Investing, Other, Management, Portfolio Diversification, Small Cap |
|
| Show Risk Definitions |
|
|
| Inception Date: 1996-12-27 |
|
| Jay S. Kaplan (2003-12-31) |
|
| Mr. Kaplan has been portfolio manager since 2011 and was previously assistant portfolio manager (2005-2011). His employer at Royce since 2000. Prior to joining the firm, he spent 12 years with Prudential Financial, most recently as a managing director and portfolio manager. |
|
|
|
|
|
|
| Royce Investment Partners |
|
|
|
|
|

© Copyright 2025 Morningstar, Inc. All rights reserved. Morningstar, the Morningstar logo, Morningstar.com, Morningstar Tools are either trademark or service marks of Morningstar, Inc. The information contained herein: (1) is proprietary to Morningstar and/or its content providers; (2) may not be copied or distributed; and (3) is not warranted to be accurate, complete or timely. Neither Morningstar nor its content providers are responsible for any damages or any losses arising from any use of information. Past performance is no guarantee of future performance. |
|
Past performance is no guarantee of future results.
Returns will vary and shares may be worth more or less than their original cost when sold.
|
|


