| T. Rowe Price All-Cap Opportunities Port |
|
 |
|
| Release date as of 2025-08-31. Data on page is subject to change. |
|
|
Overall Morningstar
Rating™
|
| What is this?
|
|
 |
| As of 2025-08-31 |
|
Out of 1031
Large Growth Funds
|
|
|
|
|
|
| Total Fund Assets ($ Mil) |
| 555.89 |
|
|
|
| Investment Objective & Strategy |
|
| The investment seeks long-term capital growth.
|
|
| The fund invests primarily (at least 65% of its total assets) in common stocks of U.S. companies operating in those sectors of the economy that, in the view of the fund's adviser are the fastest growing or have the greatest growth potential. While most assets will typically be invested in U.S. common stocks, the fund may invest in foreign stocks in keeping with the fund's objective. |
|
|
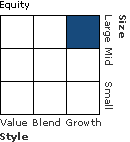
| Morningstar Category: Large Growth |
|
| Large-growth portfolios invest primarily in big U.S. companies that are projected to grow faster than other large-cap stocks. Stocks in the top 70% of the capitalization of the U.S. equity market are defined as large cap. Growth is defined based on fast growth (high growth rates for earnings, sales, book value, and cash flow) and high valuations (high price ratios and low dividend yields). Most of these portfolios focus on companies in rapidly expanding industries.
|
|
|
| There are no additional fund specific investment risks (e.g. liquidity risk, currency risk, foreign investment risk, etc.) associated with this fund beyond the normal risks generally associated with investing in a mutual fund. |
|
|
| % of Net Assets |
 |
U.S. Stocks |
89.7 |
 |
Non-U.S. Stocks |
7.6 |
 |
Bonds |
0.0 |
 |
Cash |
1.7 |
 |
Other |
1.0 |
|
|
 |
| Data through 2025-07-31 |
|
|
|
|
| Morningstar Equity Sectors |
|
|
|
% of Stocks |
 |
Cyclical |
36.33 |
 |
Basic Materials |
1.26 |
 |
Consumer Cyclical |
14.34 |
 |
Financial Services |
18.42 |
 |
Real Estate |
2.31 |
|
|
|
 |
Sensitive |
51.68 |
 |
Communication Services |
13.66 |
 |
Energy |
0.89 |
 |
Industrials |
4.42 |
 |
Technology |
32.71 |
|
|
|
 |
Defensive |
12.00 |
 |
Consumer Defensive |
1.54 |
 |
Healthcare |
9.11 |
 |
Utilities |
1.35 |
|
| Data through 2025-07-31 |
|
|
| Total Number of Stock Holdings |
95 |
| Total Number of Bond Holdings |
0 |
| % of Net Assets in Top 10 Holdings |
40.52 |
|
|
| Turnover % |
(as of 2024-12-31) |
96.50 |
| 30 Day SEC Yield % |
0.00 |
|
|
Sector |
P/E |
% of Net
Assets
|
 |
 |
 |
 |
 |
 |
NVIDIA Corp |
 |
50.52 |
8.29 |
 |
Microsoft Corp |
 |
37.38 |
8.05 |
 |
Meta Platforms Inc Class A |
 |
27.41 |
4.66 |
 |
Apple Inc |
 |
35.52 |
4.36 |
 |
Netflix Inc |
 |
50.64 |
3.11 |
 |
 |
Amazon.com Inc |
 |
34.78 |
2.90 |
 |
Broadcom Inc |
 |
92.51 |
2.60 |
|
Visa Inc Class A |
 |
33.15 |
2.33 |
 |
Bank of America Corp |
 |
14.83 |
2.18 |
 |
Alphabet Inc Class C |
 |
25.73 |
2.04 |
 |
|
 |
|
|
|
|
|
| Foreign Securities, Loss of Money, Not FDIC Insured, Growth Investing, Active Management, Market/Market Volatility, Equity Securities, Industry and Sector Investing, Other, Technology Sector |
|
| Show Risk Definitions |
|
|
| Inception Date: 1994-03-31 |
|
| Justin P. White (2016-04-01) |
|
| Justin White has been chair of the committee since 2016 He joined T. Rowe Price in 2008, and his investment experience dates from that time. He has served as a portfolio manager with the Firm throughout the past five years. He was a portfolio manager in the U.S. Equity Division of T. Rowe Price. Prior to his current role, Mr. White was an equity analyst covering Internet infrastructure companies and cable/satellite and U.S. telecom companies. He is a vice president of T. Rowe Price Group, Inc.
Mr. White joined the firm in 2008 after serving as an equity summer intern for T. Rowe Price in 2007. Prior to this, he was a senior analyst at the Analysis Group in Washington, D.C.
Mr. White earned an A.B., magna cum laude, in applied mathematics and economics from Dartmouth College and an M.B.A. from the Tuck School of Business at Dartmouth, where he was a member of Phi Beta Kappa, graduated with highest distinction, and was an Edward Tuck Scholar. He also has earned the Chartered Financial Analyst designation. |
|
|
|
| T. Rowe Price Associates, Inc. |
|
|
|
|
|
|
|
|

© Copyright 2025 Morningstar, Inc. All rights reserved. Morningstar, the Morningstar logo, Morningstar.com, Morningstar Tools are either trademark or service marks of Morningstar, Inc. The information contained herein: (1) is proprietary to Morningstar and/or its content providers; (2) may not be copied or distributed; and (3) is not warranted to be accurate, complete or timely. Neither Morningstar nor its content providers are responsible for any damages or any losses arising from any use of information. Past performance is no guarantee of future performance. |
|
Past performance is no guarantee of future results.
Returns will vary and shares may be worth more or less than their original cost when sold.
|
|


