| DWS Small Cap Index VIP A |
|
 |
|
| Release date as of 2025-09-30. Data on page is subject to change. |
|
|
| Style Box Details for Stock Holdings |
|
| Size |
|
| Average Mkt Cap $Mil |
2,797 |
|
|
|
| Market Capitalization |
% of Portfolio |
| Giant |
0.00 |
| Large |
0.66 |
| Medium |
2.19 |
| Small |
50.24 |
| Micro |
46.91 |
| |
|
|
| Investment Valuation |
Stock
Portfolio
|
| Forward P/E |
16.6 |
| Price/Book |
1.8 |
| Price/Sales |
1.2 |
| Price/Cash Flow |
8.3 |
| Dividend Yield |
1.5 |
| Long-Term Earnings |
11.5 |
| Historical Earnings |
-2.0 |
| Sales Growth |
3.0 |
| Cash-Flow Growth |
-0.8 |
| Book-Value Growth |
-17.1 |
|
|
|
 |
|
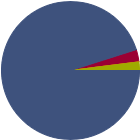
| As of 2025-08-31 |
|
|
|
| % of Net Assets |
 |
U.S. Stocks |
95.1 |
 |
Non-U.S. Stocks |
2.9 |
 |
Bonds |
0.0 |
 |
Cash |
2.0 |
 |
Other |
0.0 |
|
|
 |
| Data through 2025-08-31 |
|
|
|
| Morningstar Equity Sectors |
|
|
|
% of Stocks |
 |
Cyclical |
39.77 |
 |
Basic Materials |
4.44 |
 |
Consumer Cyclical |
10.32 |
 |
Financial Services |
17.86 |
 |
Real Estate |
7.15 |
|
|
|
 |
Sensitive |
38.39 |
 |
Communication Services |
2.58 |
 |
Energy |
4.57 |
 |
Industrials |
15.76 |
 |
Technology |
15.48 |
|
|
|
 |
Defensive |
21.85 |
 |
Consumer Defensive |
3.11 |
 |
Healthcare |
15.63 |
 |
Utilities |
3.11 |
|
| Data through 2025-08-31 |
|
|
|
|
| Total Number of Stock Holdings |
1968 |
| Total Number of Bond Holdings |
0 |
| % of Net Assets in Top 10 Holdings |
3.86 |
|
|
| Turnover % |
(as of 2024-12-31) |
20.00 |
| 30 Day SEC Yield % |
0.00 |
|
|
Sector |
P/E |
% of Net
Assets
|
 |
|
|
|
|
|
Credo Technology Group Holding Ltd |
|
--- |
0.64 |
|
Fabrinet |
|
39.47 |
0.43 |
|
Bloom Energy Corp Class A |
|
789.73 |
0.39 |
|
Kratos Defense & Security Solutions Inc |
|
946.30 |
0.39 |
|
IonQ Inc Class A |
|
--- |
0.36 |
 |
|
Ensign Group Inc |
|
31.81 |
0.35 |
|
Nextracker, Inc. |
--- |
--- |
0.34 |
|
Chart Industries Inc |
|
36.60 |
0.32 |
 |
SPX Technologies Inc |
|
41.24 |
0.32 |
|
UMB Financial Corp |
|
12.81 |
0.32 |
|
|
Coeur Mining Inc |
|
48.90 |
0.30 |
|
EchoStar Corp Class A |
|
--- |
0.30 |
|
Sterling Infrastructure Inc |
|
36.59 |
0.30 |
|
CommVault Systems Inc |
|
95.08 |
0.30 |
|
BridgeBio Pharma Inc |
|
--- |
0.29 |
|
|
Hims & Hers Health Inc Ordinary Shares - Class A |
|
68.29 |
0.29 |
|
Guardant Health Inc |
|
--- |
0.29 |
|
Rambus Inc |
|
42.45 |
0.28 |
|
AeroVironment Inc |
|
--- |
0.27 |
|
HealthEquity Inc |
|
54.86 |
0.27 |
|
|
Watts Water Technologies Inc Class A |
|
28.74 |
0.27 |
|
Oklo Inc Class A Shares |
|
32.13 |
0.27 |
|
JBT Marel Corp |
|
--- |
0.27 |
|
Federal Signal Corp |
|
32.39 |
0.26 |
|
Madrigal Pharmaceuticals Inc |
|
--- |
0.26 |
|
|
 |
|
|

© Copyright 2025 Morningstar, Inc. All rights reserved. Morningstar, the Morningstar logo, Morningstar.com, Morningstar Tools are either trademark or service marks of Morningstar, Inc. The information contained herein: (1) is proprietary to Morningstar and/or its content providers; (2) may not be copied or distributed; and (3) is not warranted to be accurate, complete or timely. Neither Morningstar nor its content providers are responsible for any damages or any losses arising from any use of information. Past performance is no guarantee of future performance. |
|
Past performance is no guarantee of future results.
Returns will vary and shares may be worth more or less than their original cost when sold.
|
|

