|
| Release date as of 2025-09-30. Data on page is subject to change. |
|
|
| Style Box Details for Stock Holdings |
|
| Size |
|
| Average Mkt Cap $Mil |
63,077 |
|
|
|
| Market Capitalization |
% of Portfolio |
| Giant |
11.72 |
| Large |
43.79 |
| Medium |
26.07 |
| Small |
16.54 |
| Micro |
1.87 |
| |
|
|
| Investment Valuation |
Stock
Portfolio
|
| Forward P/E |
24.1 |
| Price/Book |
5.3 |
| Price/Sales |
1.5 |
| Price/Cash Flow |
16.0 |
| Dividend Yield |
0.8 |
| Long-Term Earnings |
12.1 |
| Historical Earnings |
18.8 |
| Sales Growth |
12.3 |
| Cash-Flow Growth |
7.7 |
| Book-Value Growth |
7.6 |
|
|
|
 |
|
| As of 2025-08-31 |
|
|
|
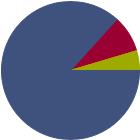
| % of Net Assets |
 |
U.S. Stocks |
86.7 |
 |
Non-U.S. Stocks |
8.7 |
 |
Bonds |
0.0 |
 |
Cash |
4.6 |
 |
Other |
0.0 |
|
|
 |
| Data through 2025-08-31 |
|
|
|
| Morningstar Equity Sectors |
|
|
|
% of Stocks |
 |
Cyclical |
2.24 |
 |
Basic Materials |
0.00 |
 |
Consumer Cyclical |
0.00 |
 |
Financial Services |
0.00 |
 |
Real Estate |
2.24 |
|
|
|
 |
Sensitive |
0.00 |
 |
Communication Services |
0.00 |
 |
Energy |
0.00 |
 |
Industrials |
0.00 |
 |
Technology |
0.00 |
|
|
|
 |
Defensive |
97.76 |
 |
Consumer Defensive |
0.00 |
 |
Healthcare |
97.76 |
 |
Utilities |
0.00 |
|
| Data through 2025-08-31 |
|
|
|
|
| Total Number of Stock Holdings |
72 |
| Total Number of Bond Holdings |
0 |
| % of Net Assets in Top 10 Holdings |
45.46 |
|
|
| Turnover % |
(as of 2024-12-31) |
57.00 |
| 30 Day SEC Yield % |
--- |
|
|
Sector |
P/E |
% of Net
Assets
|
 |
|
|
|
|
|
Boston Scientific Corp |
|
58.20 |
9.68 |
 |
Eli Lilly and Co |
|
53.66 |
7.73 |
|
Stryker Corp |
|
48.91 |
4.97 |
|
AbbVie Inc |
|
108.03 |
4.42 |
|
Cencora Inc |
|
32.79 |
4.01 |
 |
|
Abbott Laboratories |
|
16.03 |
3.47 |
 |
argenx SE ADR |
|
42.76 |
3.04 |
|
Invesco Shrt-Trm Inv Treasury Instl |
--- |
--- |
2.96 |
|
Gilead Sciences Inc |
|
23.43 |
2.74 |
|
McKesson Corp |
|
31.03 |
2.44 |
|
|
AstraZeneca PLC ADR |
|
--- |
2.37 |
|
Alnylam Pharmaceuticals Inc |
|
--- |
2.24 |
|
Tenet Healthcare Corp |
|
12.64 |
2.14 |
|
Welltower Inc |
|
--- |
2.12 |
|
Intuitive Surgical Inc |
|
60.62 |
1.98 |
|
|
Encompass Health Corp |
|
23.98 |
1.88 |
|
Lonza Group Ltd |
|
--- |
1.76 |
|
Vertex Pharmaceuticals Inc |
|
29.14 |
1.75 |
|
HCA Healthcare Inc |
|
17.64 |
1.65 |
|
Insulet Corp |
|
96.43 |
1.63 |
|
|
Labcorp Holdings Inc |
|
31.31 |
1.56 |
|
Invesco Shrt-Trm Inv Gov&Agcy Instl |
--- |
--- |
1.55 |
|
IDEXX Laboratories Inc |
|
53.07 |
1.52 |
|
UnitedHealth Group Inc |
|
15.44 |
1.49 |
|
Ascendis Pharma AS ADR |
|
--- |
1.49 |
|
|
 |
|
|

© Copyright 2025 Morningstar, Inc. All rights reserved. Morningstar, the Morningstar logo, Morningstar.com, Morningstar Tools are either trademark or service marks of Morningstar, Inc. The information contained herein: (1) is proprietary to Morningstar and/or its content providers; (2) may not be copied or distributed; and (3) is not warranted to be accurate, complete or timely. Neither Morningstar nor its content providers are responsible for any damages or any losses arising from any use of information. Past performance is no guarantee of future performance. |
|
Past performance is no guarantee of future results.
Returns will vary and shares may be worth more or less than their original cost when sold.
|
|

