| Royce Capital Micro-Cap Inv |
|
 |
|
| Release date as of 2025-09-30. Data on page is subject to change. |
|
|
| Style Box Details for Stock Holdings |
|
| Size |
|
| Average Mkt Cap $Mil |
714 |
|
|
|
| Market Capitalization |
% of Portfolio |
| Giant |
0.00 |
| Large |
1.02 |
| Medium |
0.77 |
| Small |
11.93 |
| Micro |
86.28 |
| |
|
|
| Investment Valuation |
Stock
Portfolio
|
| Forward P/E |
18.5 |
| Price/Book |
1.7 |
| Price/Sales |
1.0 |
| Price/Cash Flow |
10.8 |
| Dividend Yield |
0.7 |
| Long-Term Earnings |
7.1 |
| Historical Earnings |
-5.1 |
| Sales Growth |
0.0 |
| Cash-Flow Growth |
-11.3 |
| Book-Value Growth |
2.0 |
|
|
|
 |
|
| As of 2025-09-30 |
|
|
|
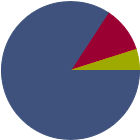
| % of Net Assets |
 |
U.S. Stocks |
84.2 |
 |
Non-U.S. Stocks |
10.9 |
 |
Bonds |
0.0 |
 |
Cash |
4.9 |
 |
Other |
0.0 |
|
|
 |
| Data through 2025-09-30 |
|
|
|
| Morningstar Equity Sectors |
|
|
|
% of Stocks |
 |
Cyclical |
32.11 |
 |
Basic Materials |
4.90 |
 |
Consumer Cyclical |
10.88 |
 |
Financial Services |
15.57 |
 |
Real Estate |
0.76 |
|
|
|
 |
Sensitive |
54.63 |
 |
Communication Services |
2.61 |
 |
Energy |
4.56 |
 |
Industrials |
23.39 |
 |
Technology |
24.07 |
|
|
|
 |
Defensive |
13.25 |
 |
Consumer Defensive |
3.67 |
 |
Healthcare |
9.58 |
 |
Utilities |
0.00 |
|
| Data through 2025-09-30 |
|
|
|
|
| Total Number of Stock Holdings |
151 |
| Total Number of Bond Holdings |
0 |
| % of Net Assets in Top 10 Holdings |
10.76 |
|
|
| Turnover % |
(as of 2024-12-31) |
19.00 |
| 30 Day SEC Yield % |
--- |
|
|
Sector |
P/E |
% of Net
Assets
|
 |
|
|
|
|
 |
LightPath Technologies Inc Class A |
|
--- |
1.13 |
|
NPK International Inc |
|
28.00 |
1.11 |
|
Investar Holding Corp |
|
10.76 |
1.09 |
|
Astronics Corp |
|
--- |
1.08 |
|
CECO Environmental Corp |
|
33.58 |
1.08 |
 |
|
Natural Gas Services Group Inc |
|
19.63 |
1.07 |
|
nLight Inc |
|
--- |
1.06 |
|
Sprott Inc |
|
--- |
1.06 |
|
Graham Corp |
|
49.37 |
1.05 |
|
Montrose Environmental Group Inc Ordinary Shares |
|
--- |
1.03 |
|
|
Lincoln Educational Services Corp |
|
45.54 |
1.03 |
|
IES Holdings Inc |
|
29.72 |
1.02 |
|
Bel Fuse Inc Class B |
|
28.85 |
1.02 |
|
Western New England Bancorp Inc |
|
17.35 |
1.01 |
|
Imax Corp |
|
45.68 |
1.01 |
|
|
Digi International Inc |
|
33.32 |
1.01 |
|
Kopin Corp |
|
--- |
1.00 |
|
NWPX Infrastructure Inc |
|
15.38 |
1.00 |
|
Harrow Inc |
|
--- |
0.99 |
|
Nova Ltd |
|
--- |
0.97 |
|
|
Canaccord Genuity Group Inc |
|
--- |
0.95 |
|
EZCORP Inc |
|
14.04 |
0.95 |
|
Ameresco Inc Class A |
|
33.31 |
0.94 |
 |
Luxfer Holdings PLC |
|
--- |
0.94 |
|
Establishment Labs Holdings Inc |
|
--- |
0.93 |
|
|
 |
|
|

© Copyright 2025 Morningstar, Inc. All rights reserved. Morningstar, the Morningstar logo, Morningstar.com, Morningstar Tools are either trademark or service marks of Morningstar, Inc. The information contained herein: (1) is proprietary to Morningstar and/or its content providers; (2) may not be copied or distributed; and (3) is not warranted to be accurate, complete or timely. Neither Morningstar nor its content providers are responsible for any damages or any losses arising from any use of information. Past performance is no guarantee of future performance. |
|
Past performance is no guarantee of future results.
Returns will vary and shares may be worth more or less than their original cost when sold.
|
|

