| Fidelity VIP Mid Cap Service 2 |
|
 |
|
| Release date as of 2025-09-30. Data on page is subject to change. |
|
|
| Style Box Details for Stock Holdings |
|
| Size |
|
| Average Mkt Cap $Mil |
11,573 |
|
|
|
| Market Capitalization |
% of Portfolio |
| Giant |
0.99 |
| Large |
3.04 |
| Medium |
43.70 |
| Small |
48.49 |
| Micro |
3.78 |
| |
|
|
| Investment Valuation |
Stock
Portfolio
|
| Forward P/E |
19.0 |
| Price/Book |
2.6 |
| Price/Sales |
1.7 |
| Price/Cash Flow |
5.7 |
| Dividend Yield |
1.1 |
| Long-Term Earnings |
11.7 |
| Historical Earnings |
6.5 |
| Sales Growth |
6.4 |
| Cash-Flow Growth |
11.9 |
| Book-Value Growth |
7.8 |
|
|
|
 |
|
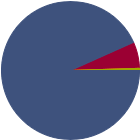
| As of 2025-08-31 |
|
|
|
| % of Net Assets |
 |
U.S. Stocks |
93.4 |
 |
Non-U.S. Stocks |
6.2 |
 |
Bonds |
0.0 |
 |
Cash |
0.5 |
 |
Other |
0.0 |
|
|
 |
| Data through 2025-08-31 |
|
|
|
| Morningstar Equity Sectors |
|
|
|
% of Stocks |
 |
Cyclical |
41.13 |
 |
Basic Materials |
3.94 |
 |
Consumer Cyclical |
12.08 |
 |
Financial Services |
19.23 |
 |
Real Estate |
5.88 |
|
|
|
 |
Sensitive |
36.94 |
 |
Communication Services |
1.67 |
 |
Energy |
3.22 |
 |
Industrials |
19.48 |
 |
Technology |
12.57 |
|
|
|
 |
Defensive |
21.96 |
 |
Consumer Defensive |
5.98 |
 |
Healthcare |
12.34 |
 |
Utilities |
3.64 |
|
| Data through 2025-08-31 |
|
|
|
|
| Total Number of Stock Holdings |
181 |
| Total Number of Bond Holdings |
0 |
| % of Net Assets in Top 10 Holdings |
14.08 |
|
|
| Turnover % |
(as of 2024-12-31) |
52.00 |
| 30 Day SEC Yield % |
--- |
|
|
Sector |
P/E |
% of Net
Assets
|
 |
|
|
|
|
 |
Comfort Systems USA Inc |
|
42.77 |
1.67 |
|
EMCOR Group Inc |
|
28.01 |
1.64 |
|
ITT Inc |
|
27.07 |
1.52 |
|
RB Global Inc |
|
--- |
1.45 |
|
East West Bancorp Inc |
|
12.09 |
1.43 |
 |
|
Equitable Holdings Inc |
|
41.67 |
1.35 |
|
Reinsurance Group of America Inc |
|
17.13 |
1.31 |
|
Somnigroup International Inc |
|
59.83 |
1.25 |
|
Wintrust Financial Corp |
|
12.45 |
1.23 |
|
US Foods Holding Corp |
|
32.95 |
1.23 |
|
|
Primerica Inc |
|
12.87 |
1.17 |
|
Service Corp International |
|
22.28 |
1.16 |
|
Lumentum Holdings Inc |
|
423.73 |
1.16 |
|
Western Digital Corp |
|
25.42 |
1.15 |
|
BJ's Wholesale Club Holdings Inc |
|
21.58 |
1.14 |
|
 |
Performance Food Group Co |
|
47.49 |
1.11 |
|
Grand Canyon Education Inc |
|
25.88 |
1.07 |
|
Elanco Animal Health Inc |
|
23.24 |
1.05 |
|
AptarGroup Inc |
|
22.42 |
1.01 |
|
Coherent Corp |
|
--- |
1.01 |
|
|
Old National Bancorp |
|
12.92 |
1.01 |
|
Alaska Air Group Inc |
|
20.17 |
0.99 |
|
Flex Ltd |
|
--- |
0.97 |
|
Ventas Inc |
|
--- |
0.92 |
|
Aramark |
|
29.32 |
0.90 |
|
|
 |
|
|

© Copyright 2025 Morningstar, Inc. All rights reserved. Morningstar, the Morningstar logo, Morningstar.com, Morningstar Tools are either trademark or service marks of Morningstar, Inc. The information contained herein: (1) is proprietary to Morningstar and/or its content providers; (2) may not be copied or distributed; and (3) is not warranted to be accurate, complete or timely. Neither Morningstar nor its content providers are responsible for any damages or any losses arising from any use of information. Past performance is no guarantee of future performance. |
|
Past performance is no guarantee of future results.
Returns will vary and shares may be worth more or less than their original cost when sold.
|
|

