| T. Rowe Price Health Sciences Port |
|
 |
|
| Release date as of 2025-09-30. Data on page is subject to change. |
|
|
| Style Box Details for Stock Holdings |
|
| Size |
|
| Average Mkt Cap $Mil |
59,713 |
|
|
|
| Market Capitalization |
% of Portfolio |
| Giant |
13.71 |
| Large |
37.78 |
| Medium |
28.02 |
| Small |
15.10 |
| Micro |
5.39 |
| |
|
|
| Investment Valuation |
Stock
Portfolio
|
| Forward P/E |
20.8 |
| Price/Book |
4.2 |
| Price/Sales |
1.8 |
| Price/Cash Flow |
16.2 |
| Dividend Yield |
0.8 |
| Long-Term Earnings |
9.3 |
| Historical Earnings |
2.3 |
| Sales Growth |
12.2 |
| Cash-Flow Growth |
-12.7 |
| Book-Value Growth |
8.3 |
|
|
|
 |
|
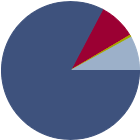
| As of 2025-09-30 |
|
|
|
| % of Net Assets |
 |
U.S. Stocks |
82.8 |
 |
Non-U.S. Stocks |
8.8 |
 |
Bonds |
0.0 |
 |
Cash |
0.5 |
 |
Other |
8.0 |
|
|
 |
| Data through 2025-09-30 |
|
|
|
| Morningstar Equity Sectors |
|
|
|
% of Stocks |
 |
Cyclical |
0.00 |
 |
Basic Materials |
0.00 |
 |
Consumer Cyclical |
0.00 |
 |
Financial Services |
0.00 |
 |
Real Estate |
0.00 |
|
|
|
 |
Sensitive |
0.00 |
 |
Communication Services |
0.00 |
 |
Energy |
0.00 |
 |
Industrials |
0.00 |
 |
Technology |
0.00 |
|
|
|
 |
Defensive |
100.00 |
 |
Consumer Defensive |
0.00 |
 |
Healthcare |
100.00 |
 |
Utilities |
0.00 |
|
| Data through 2025-09-30 |
|
|
|
|
| Total Number of Stock Holdings |
128 |
| Total Number of Bond Holdings |
0 |
| % of Net Assets in Top 10 Holdings |
48.25 |
|
|
| Turnover % |
(as of 2024-12-31) |
49.90 |
| 30 Day SEC Yield % |
0.00 |
|
|
Sector |
P/E |
% of Net
Assets
|
 |
|
|
|
|
 |
Eli Lilly and Co |
|
41.38 |
8.71 |
|
Aggregate Miscellaneous Equity |
--- |
--- |
7.90 |
|
Intuitive Surgical Inc |
|
70.11 |
4.75 |
|
argenx SE ADR |
|
35.03 |
4.68 |
|
Stryker Corp |
|
48.87 |
4.58 |
 |
 |
UnitedHealth Group Inc |
|
17.97 |
4.11 |
|
Thermo Fisher Scientific Inc |
|
32.13 |
3.76 |
|
AbbVie Inc |
|
108.67 |
3.38 |
|
Alnylam Pharmaceuticals Inc |
|
1498.53 |
3.27 |
|
Insmed Inc |
|
--- |
3.11 |
|
|
Gilead Sciences Inc |
|
18.33 |
2.74 |
|
Danaher Corp |
|
44.25 |
2.52 |
|
Boston Scientific Corp |
|
53.78 |
2.46 |
|
Vertex Pharmaceuticals Inc |
|
29.95 |
2.41 |
|
AstraZeneca PLC ADR |
|
--- |
2.34 |
|
|
Beone Medicines |
--- |
--- |
1.94 |
|
The Cigna Group |
|
10.94 |
1.64 |
|
Regeneron Pharmaceuticals Inc |
|
15.68 |
1.52 |
|
Ascendis Pharma AS ADR |
|
--- |
1.50 |
|
Penumbra Inc |
|
61.42 |
1.35 |
|
|
Tenet Healthcare Corp |
|
14.18 |
1.08 |
|
Avidity Biosciences Inc Ordinary Shares |
|
--- |
1.01 |
|
Elevance Health Inc |
|
13.12 |
0.98 |
|
Natera Inc |
|
--- |
0.98 |
|
CVS Health Corp |
|
201.82 |
0.97 |
|
|
 |
|
|

© Copyright 2025 Morningstar, Inc. All rights reserved. Morningstar, the Morningstar logo, Morningstar.com, Morningstar Tools are either trademark or service marks of Morningstar, Inc. The information contained herein: (1) is proprietary to Morningstar and/or its content providers; (2) may not be copied or distributed; and (3) is not warranted to be accurate, complete or timely. Neither Morningstar nor its content providers are responsible for any damages or any losses arising from any use of information. Past performance is no guarantee of future performance. |
|
Past performance is no guarantee of future results.
Returns will vary and shares may be worth more or less than their original cost when sold.
|
|

