| Fidelity VIP Freedom 2030 Service 2 |
|
 |
|
| Release date as of 2025-09-30. Data on page is subject to change. |
|
|
|
 |
|
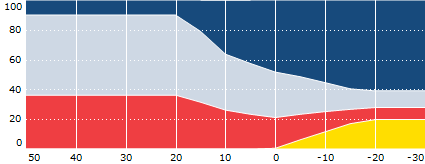
| Allocation |
 |
Bonds |
 |
US Stocks |
 |
Non-US Stocks |
 |
Cash |
 |
Other |
|
|
|
|
|
| Style Box Details for Stock Holdings |
|
| Size |
|
| Average Mkt Cap $Mil |
118,303 |
|
|
|
| Market Capitalization |
% of Portfolio |
| Giant |
48.23 |
| Large |
29.29 |
| Medium |
16.09 |
| Small |
5.66 |
| Micro |
0.74 |
| |
|
|
| Investment Valuation |
Stock
Portfolio
|
| Forward P/E |
19.4 |
| Price/Book |
2.9 |
| Price/Sales |
2.3 |
| Price/Cash Flow |
11.0 |
| Dividend Yield |
1.9 |
| Long-Term Earnings |
9.8 |
| Historical Earnings |
9.1 |
| Sales Growth |
5.4 |
| Cash-Flow Growth |
4.3 |
| Book-Value Growth |
8.3 |
|
|
|
 |
|
| As of 2025-08-31 |
|
|
|
| Style Box Details for Bond Holdings |
|
| Average Eff Duration |
7.94 Yrs
|
| Average Eff Maturity |
--- |
| Average Wtd Coupon |
3.47 |
| Average Wtd Price |
93.02 |
|
 |
|
 |
|
| As of 2025-09-30 |
|
|
| Data as of 2025-09-30 |
|
|
| % of Net Assets |
 |
U.S. Stocks |
29.3 |
 |
Non-U.S. Stocks |
28.1 |
 |
Bonds |
37.7 |
 |
Cash |
4.2 |
 |
Other |
0.7 |
|
|
 |
| Data through 2025-08-31 |
|
|
|
| Morningstar Equity Sectors |
|
|
|
% of Stocks |
 |
Cyclical |
37.15 |
 |
Basic Materials |
5.70 |
 |
Consumer Cyclical |
8.91 |
 |
Financial Services |
21.40 |
 |
Real Estate |
1.14 |
|
|
|
 |
Sensitive |
48.88 |
 |
Communication Services |
9.84 |
 |
Energy |
2.95 |
 |
Industrials |
16.90 |
 |
Technology |
19.19 |
|
|
|
 |
Defensive |
13.98 |
 |
Consumer Defensive |
3.91 |
 |
Healthcare |
7.97 |
 |
Utilities |
2.10 |
|
| Data through 2025-08-31 |
|
|
| Morningstar Fixed-Income Sectors |
|
| % Fund |
 |
Government |
60.16 |
 |
Corporate |
13.55 |
 |
Securitized |
17.08 |
 |
Municipal |
0.01 |
 |
Cash & Equivalents |
8.01 |
 |
Derivative |
1.19 |
|
|
|
% Bonds |
| AAA |
85.70 |
| AA |
2.34 |
| A |
5.72 |
| BBB |
6.28 |
| BB |
1.56 |
| B |
1.41 |
| Below B |
0.00 |
| Not Rated |
-3.00 |
|
|
|
|
|
|
|
| Total Number of Stock Holdings |
0 |
| Total Number of Bond Holdings |
0 |
| % of Net Assets in Top 10 Holdings |
93.12 |
|
|
| Turnover % |
(as of 2024-12-31) |
31.00 |
| 30 Day SEC Yield % |
--- |
|
|
Sector |
Country |
Maturity Date |
Market Value ($000) |
% of Net Assets |
|
| Fidelity VIP Investment Grd Bd II Initl |
--- |
USA |
--- |
181,406 |
20.37 |
| Fidelity VIP Overseas Initial |
--- |
USA |
--- |
169,404 |
19.02 |
| Fidelity VIP Growth Initial |
--- |
USA |
--- |
83,065 |
9.33 |
| Fidelity VIP Emerging Markets Initial |
--- |
USA |
--- |
78,130 |
8.77 |
| Fidelity Inflation-Prot Bd Index |
--- |
USA |
--- |
70,419 |
7.91 |
 |
| Fidelity Long-Term Trs Bd Index |
--- |
USA |
--- |
68,100 |
7.65 |
| Fidelity VIP Growth & Income Initial |
--- |
USA |
--- |
56,648 |
6.36 |
| Fidelity VIP Contrafund Initial |
--- |
USA |
--- |
51,160 |
5.74 |
| Fidelity VIP Equity-Income Initial |
--- |
USA |
--- |
41,483 |
4.66 |
| Fidelity VIP Value Initial |
--- |
USA |
--- |
29,505 |
3.31 |
|
| Fidelity VIP Government MMKT Initial |
--- |
USA |
--- |
16,332 |
1.83 |
| Fidelity VIP Value Strategies Initial |
--- |
USA |
--- |
14,686 |
1.65 |
| Fidelity VIP Mid Cap Initial |
--- |
USA |
--- |
13,094 |
1.47 |
| Fidelity VIP High Income Initial |
--- |
USA |
--- |
10,824 |
1.22 |
| Fidelity International Bond Index |
--- |
USA |
--- |
6,178 |
0.69 |
|
|
 |
|
|

© Copyright 2025 Morningstar, Inc. All rights reserved. Morningstar, the Morningstar logo, Morningstar.com, Morningstar Tools are either trademark or service marks of Morningstar, Inc. The information contained herein: (1) is proprietary to Morningstar and/or its content providers; (2) may not be copied or distributed; and (3) is not warranted to be accurate, complete or timely. Neither Morningstar nor its content providers are responsible for any damages or any losses arising from any use of information. Past performance is no guarantee of future performance. |
|
Past performance is no guarantee of future results.
Returns will vary and shares may be worth more or less than their original cost when sold.
|
|


