| Fidelity VIP Asset Manager 50% Initial |
|
 |
|
| Release date as of 2025-09-30. Data on page is subject to change. |
|
|
Overall Morningstar
Rating™
|
| What is this?
|
|
 |
| As of 2025-09-30 |
|
Out of 466
Moderate Allocation Funds
|
|
|
|
Morningstar®
Style Box™
|
| What is this?
|
|
 |
|
| As of 2025-07-31 |
|
 |
|
| As of 2025-07-31 |
|
|
| Total Fund Assets ($ Mil) |
| 943.51 |
|
|
|
| Investment Objective & Strategy |
|
| The investment seeks to obtain high total return with reduced risk over the long term by allocating its assets among stocks, bonds, and short-term instruments.
|
|
| The adviser maintains a neutral mix over time of 50% of assets in stocks, 40% of assets in bonds, and 10% of assets in short-term and money market instruments. The adviser adjusts allocation among asset classes gradually within the following ranges: stock class (30%-70%), bond class (20%-60%), and short-term/money market class (0%-50%). |
|
|
| Morningstar Category: Moderate Allocation |
|
| Funds in allocation categories seek to provide both income and capital appreciation by primarily investing in multiple asset classes, including stocks, bonds, and cash. These moderate strategies seek to balance preservation of capital with appreciation. They typically expect volatility similar to a strategic equity exposure between 50% and 70%.
|
|
|
| There are no additional fund specific investment risks (e.g. liquidity risk, currency risk, foreign investment risk, etc.) associated with this fund beyond the normal risks generally associated with investing in a mutual fund. |
|
|
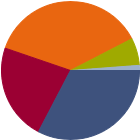
| % of Net Assets |
 |
U.S. Stocks |
32.7 |
 |
Non-U.S. Stocks |
22.6 |
 |
Bonds |
37.2 |
 |
Cash |
6.4 |
 |
Other |
1.2 |
|
|
 |
| Data through 2025-07-31 |
|
|
|
|
| Morningstar Equity Sectors |
|
|
|
% of Stocks |
 |
Cyclical |
34.68 |
 |
Basic Materials |
4.02 |
 |
Consumer Cyclical |
10.70 |
 |
Financial Services |
17.82 |
 |
Real Estate |
2.14 |
|
|
|
 |
Sensitive |
50.73 |
 |
Communication Services |
9.01 |
 |
Energy |
3.13 |
 |
Industrials |
12.98 |
 |
Technology |
25.61 |
|
|
|
 |
Defensive |
14.60 |
 |
Consumer Defensive |
4.48 |
 |
Healthcare |
8.11 |
 |
Utilities |
2.01 |
|
| Data through 2025-07-31 |
|
|
|
| Morningstar Fixed-Income Sectors |
|
| % Fund |
 |
Government |
44.27 |
 |
Corporate |
21.88 |
 |
Securitized |
20.46 |
 |
Municipal |
0.00 |
 |
Cash & Equivalents |
12.52 |
 |
Derivative |
0.87 |
|
|
|
% Bonds |
| AAA |
69.04 |
| AA |
2.98 |
| A |
8.24 |
| BBB |
11.88 |
| BB |
3.62 |
| B |
2.50 |
| Below B |
0.00 |
| Not Rated |
1.75 |
|
|
|
|
|
| Total Number of Stock Holdings |
804 |
| Total Number of Bond Holdings |
3301 |
| % of Net Assets in Top 10 Holdings |
21.28 |
|
|
| Turnover % |
(as of 2024-12-31) |
16.00 |
| 30 Day SEC Yield % |
--- |
|
|
Sector |
Country |
Maturity Date |
Market Value ($000) |
% of Net Assets |
|
| Fidelity Cash Central Fund |
--- |
USA |
--- |
48,532 |
5.30 |
| NVIDIA Corp |
|
USA |
--- |
21,898 |
2.39 |
| Fidelity Enhanced Small Cap ETF |
--- |
USA |
--- |
21,276 |
2.32 |
| Microsoft Corp |
|
USA |
--- |
20,956 |
2.29 |
| Fidelity Blue Chip Growth ETF |
--- |
USA |
--- |
20,695 |
2.26 |
 |
| Apple Inc |
|
USA |
--- |
15,700 |
1.71 |
| Alphabet Inc Class A |
|
USA |
--- |
11,745 |
1.28 |
| Amazon.com Inc |
|
USA |
--- |
11,560 |
1.26 |
| United States Treasury Notes 3.875% |
--- |
USA |
2034-08-15 |
11,374 |
1.24 |
| iShares 20+ Year Treasury Bond ETF |
--- |
USA |
--- |
11,235 |
1.23 |
|
|
 |
|
|
|
|
|
| Prepayment (Call), Foreign Securities, Loss of Money, Not FDIC Insured, Country or Region, Income, Issuer, Interest Rate, Market/Market Volatility, Equity Securities, ETF |
|
| Show Risk Definitions |
|
|
| Inception Date: 1989-09-06 |
|
| Katherine Shaw (2023-11-01) |
|
| Katherine Shaw is Co-Portfolio Manager of each fund, which she has managed since 2023. She also manages other funds. Since joining Fidelity Investments in 2007, Ms. Shaw has worked as a sector leader and portfolio manager. |
|
| Avishek Hazrachoudhury (2018-04-30) |
|
| Avishek Hazrachoudhury joined Fidelity Investments in 2013, since then he has worked as a quantitative analyst and portfolio manager. |
|
|
|
| Fidelity Management & Research Company LLC |
|
|
|
|
|
| FMR Investment Management (U.K.) Limited |
| Fidelity Management & Research (Japan) Limited |
| Fidelity Management & Research (HK) Ltd |
|
|

© Copyright 2025 Morningstar, Inc. All rights reserved. Morningstar, the Morningstar logo, Morningstar.com, Morningstar Tools are either trademark or service marks of Morningstar, Inc. The information contained herein: (1) is proprietary to Morningstar and/or its content providers; (2) may not be copied or distributed; and (3) is not warranted to be accurate, complete or timely. Neither Morningstar nor its content providers are responsible for any damages or any losses arising from any use of information. Past performance is no guarantee of future performance. |
|
Past performance is no guarantee of future results.
Returns will vary and shares may be worth more or less than their original cost when sold.
|
|

