| Vanguard VIF Equity Index |
|
 |
|
| Release date as of 2025-09-30. Data on page is subject to change. |
|
|
Overall Morningstar
Rating™
|
| What is this?
|
|
 |
| As of 2025-09-30 |
|
Out of 1226
Large Blend Funds
|
|
|
|
|
|
| Total Fund Assets ($ Mil) |
| 12,932.3 |
|
|
|
| Investment Objective & Strategy |
|
| The investment seeks to track the performance of the Standard & Poor’s 500 Index that measures the investment return of large-capitalization stocks.
|
|
| The Portfolio employs an indexing investment approach designed to track the performance of the Standard & Poor's 500 Index, a widely recognized benchmark of U.S. stock market performance that is dominated by the stocks of large U.S. companies. The advisor attempts to replicate the index by investing all, or substantially all, of its assets in the stocks that make up the index, holding each stock in approximately the same proportion as its weighting in the index. It is non-diversified. |
|
|
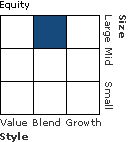
| Morningstar Category: Large Blend |
|
| Large-blend portfolios are fairly representative of the overall US stock market in size, growth
rates and price. Stocks in the top 70% of the capitalization of the US equity market are defined
as large cap. The blend style is assigned to portfolios where neither growth nor value
characteristics predominate. These portfolios tend to invest across the spectrum of US
industries, and owing to their broad exposure, the portfolios' returns are often similar to those of the S&P 500 Index.
|
|
|
| Non-Diversified Funds: Funds that invest more of their assets in a single issuer involve additional risks, including share price fluctuations, because of the increased concentration of investments. |
|
|
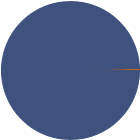
| % of Net Assets |
 |
U.S. Stocks |
99.5 |
 |
Non-U.S. Stocks |
0.4 |
 |
Bonds |
0.0 |
 |
Cash |
0.1 |
 |
Other |
0.0 |
|
|
 |
| Data through 2025-09-30 |
|
|
|
|
| Morningstar Equity Sectors |
|
|
|
% of Stocks |
 |
Cyclical |
27.39 |
 |
Basic Materials |
1.58 |
 |
Consumer Cyclical |
10.67 |
 |
Financial Services |
13.20 |
 |
Real Estate |
1.94 |
|
|
|
 |
Sensitive |
56.50 |
 |
Communication Services |
10.48 |
 |
Energy |
2.89 |
 |
Industrials |
7.51 |
 |
Technology |
35.62 |
|
|
|
 |
Defensive |
16.12 |
 |
Consumer Defensive |
4.91 |
 |
Healthcare |
8.86 |
 |
Utilities |
2.35 |
|
| Data through 2025-09-30 |
|
|
| Total Number of Stock Holdings |
503 |
| Total Number of Bond Holdings |
0 |
| % of Net Assets in Top 10 Holdings |
38.84 |
|
|
| Turnover % |
(as of 2024-12-31) |
4.00 |
| 30 Day SEC Yield % |
1.05 |
|
|
Sector |
P/E |
% of Net
Assets
|
 |
|
|
|
|
 |
NVIDIA Corp |
|
51.47 |
7.97 |
|
Microsoft Corp |
|
37.95 |
6.74 |
|
Apple Inc |
|
39.87 |
6.62 |
 |
Amazon.com Inc |
|
33.85 |
3.73 |
|
Meta Platforms Inc Class A |
|
26.60 |
2.79 |
 |
|
Broadcom Inc |
|
88.09 |
2.72 |
|
Alphabet Inc Class A |
|
26.70 |
2.48 |
|
Tesla Inc |
|
255.84 |
2.19 |
|
Alphabet Inc Class C |
|
26.80 |
1.99 |
|
Berkshire Hathaway Inc Class B |
|
16.86 |
1.61 |
|
|
 |
|
|
|
|
|
| Loss of Money, Not FDIC Insured, Nondiversification, Index Correlation/Tracking Error, Market/Market Volatility, Equity Securities, Industry and Sector Investing, Management |
|
| Show Risk Definitions |
|
|
| Inception Date: 1991-04-29 |
|
| Walter Nejman (2025-02-18) |
|
| Walter Nejman, Portfolio Manager at Vanguard. He has been with Vanguard since 2005; has worked in investment management since 2008; and has co-managed the Communication Services Index, Health Care Index, Industrials Index, and Information Technology Index Funds since 2015. Education: B.A., Arcadia University; M.B.A., Villanova University. |
|
| Michelle Louie (2017-11-30) |
|
| Michelle Louie, CFA, Portfolio Manager at Vanguard. She has been with Vanguard since 2010, has worked in investment management since 2011. Education: B.S., The American University; M.B.A., Georgia Institute of Technology. |
|
| Aurélie Denis (2023-08-04) |
|
| Aurélie Denis, CFA, Portfolio Manager at Vanguard. She has been with Vanguard since 2016, has worked in investment management since 2017, has managed investment portfolios since 2023, and has co-managed the Fund since February 2023. Education: B.S., Pennsylvania State University. |
|
|
|
|
|
|
|
|
|
|
|
|

© Copyright 2025 Morningstar, Inc. All rights reserved. Morningstar, the Morningstar logo, Morningstar.com, Morningstar Tools are either trademark or service marks of Morningstar, Inc. The information contained herein: (1) is proprietary to Morningstar and/or its content providers; (2) may not be copied or distributed; and (3) is not warranted to be accurate, complete or timely. Neither Morningstar nor its content providers are responsible for any damages or any losses arising from any use of information. Past performance is no guarantee of future performance. |
|
Past performance is no guarantee of future results.
Returns will vary and shares may be worth more or less than their original cost when sold.
|
|