|
| Release date as of 2025-09-30. Data on page is subject to change. |
|
|
Overall Morningstar
Rating™
|
| What is this?
|
|
 |
| As of 2025-09-30 |
|
Out of 1024
Large Growth Funds
|
|
|
|
|
|
| Total Fund Assets ($ Mil) |
| 657.68 |
|
|
|
| Investment Objective & Strategy |
|
| The investment seeks investment results that correspond to the investment performance of U.S. common stocks, as represented by the NASDAQ 100 Index.
|
|
| Under normal circumstances, the fund will invest at least 80% of its net assets in investments with economic characteristics similar to the stocks represented in the index. It will invest primarily in common stocks of the companies that compose the index. The index is an unmanaged index comprising common stocks of the 100 largest domestic and international non-financial companies on the broader NASDAQ Composite Index based on market capitalization. The fund is non-diversified. |
|
|
| Morningstar Category: Large Growth |
|
| Large-growth portfolios invest primarily in big U.S. companies that are projected to grow faster than other large-cap stocks. Stocks in the top 70% of the capitalization of the U.S. equity market are defined as large cap. Growth is defined based on fast growth (high growth rates for earnings, sales, book value, and cash flow) and high valuations (high price ratios and low dividend yields). Most of these portfolios focus on companies in rapidly expanding industries.
|
|
|
| Non-Diversified Funds: Funds that invest more of their assets in a single issuer involve additional risks, including share price fluctuations, because of the increased concentration of investments. |
|
|
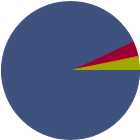
| % of Net Assets |
 |
U.S. Stocks |
93.1 |
 |
Non-U.S. Stocks |
3.7 |
 |
Bonds |
0.3 |
 |
Cash |
3.0 |
 |
Other |
0.0 |
|
|
 |
| Data through 2025-08-31 |
|
|
|
|
| Morningstar Equity Sectors |
|
|
|
% of Stocks |
 |
Cyclical |
15.18 |
 |
Basic Materials |
1.27 |
 |
Consumer Cyclical |
13.31 |
 |
Financial Services |
0.39 |
 |
Real Estate |
0.21 |
|
|
|
 |
Sensitive |
73.95 |
 |
Communication Services |
16.25 |
 |
Energy |
0.50 |
 |
Industrials |
3.67 |
 |
Technology |
53.53 |
|
|
|
 |
Defensive |
10.87 |
 |
Consumer Defensive |
4.94 |
 |
Healthcare |
4.57 |
 |
Utilities |
1.36 |
|
| Data through 2025-08-31 |
|
|
| Total Number of Stock Holdings |
101 |
| Total Number of Bond Holdings |
1 |
| % of Net Assets in Top 10 Holdings |
49.75 |
|
|
| Turnover % |
(as of 2024-12-31) |
10.00 |
| 30 Day SEC Yield % |
0.00 |
|
|
Sector |
P/E |
% of Net
Assets
|
 |
|
|
|
|
|
NVIDIA Corp |
|
52.91 |
9.15 |
|
Microsoft Corp |
|
38.39 |
8.11 |
|
Apple Inc |
|
39.88 |
7.47 |
|
Amazon.com Inc |
|
34.18 |
5.23 |
|
Broadcom Inc |
|
91.04 |
4.98 |
 |
|
Meta Platforms Inc Class A |
|
26.78 |
3.45 |
 |
Invesco QQQ Trust |
--- |
--- |
3.00 |
 |
Msilf Government Portfolio Msilf Government Portfolio |
--- |
--- |
2.97 |
|
Netflix Inc |
|
45.73 |
2.72 |
|
Alphabet Inc Class A |
|
27.71 |
2.67 |
|
|
 |
|
|
|
|
|
| Lending, Foreign Securities, Long-Term Outlook and Projections, Loss of Money, Not FDIC Insured, Nondiversification, Index Correlation/Tracking Error, Issuer, Market/Market Volatility, Equity Securities, ETF, Industry and Sector Investing, Restricted/Illiquid Securities, Derivatives, Shareholder Activity, Passive Management, Portfolio Diversification, Technology Sector |
|
| Show Risk Definitions |
|
|
| Inception Date: 2000-04-27 |
|
| Kevin L. Keene (2008-11-30) |
|
| Kevin L. Keene,
CFA May 2014 -present: Portfolio Manager, Ameritas Investment Partners, Inc.
April 2013-April 2014: Assistant Portfolio Manager, Ameritas Investment Partners, Inc.
2011-2013: Senior Analyst, Ameritas Investment Partners, Inc.
2008-2011: Equity Index and Derivatives Analyst, Ameritas Investment Partners, Inc. |
|
|
|
| Calvert Research and Management |
|
|
| Calvert Research and Management |
|
|
| Ameritas Investment Partners, Inc |
|
|

© Copyright 2025 Morningstar, Inc. All rights reserved. Morningstar, the Morningstar logo, Morningstar.com, Morningstar Tools are either trademark or service marks of Morningstar, Inc. The information contained herein: (1) is proprietary to Morningstar and/or its content providers; (2) may not be copied or distributed; and (3) is not warranted to be accurate, complete or timely. Neither Morningstar nor its content providers are responsible for any damages or any losses arising from any use of information. Past performance is no guarantee of future performance. |
|
Past performance is no guarantee of future results.
Returns will vary and shares may be worth more or less than their original cost when sold.
|
|