| CVT Russell 2000 Small Cap Idx I |
|
 |
|
| Release date as of 2025-09-30. Data on page is subject to change. |
|
|
Overall Morningstar
Rating™
|
| What is this?
|
|
 |
| As of 2025-09-30 |
|
Out of 568
Small Blend Funds
|
|
|
|
|
|
| Total Fund Assets ($ Mil) |
| 251.52 |
|
|
|
| Investment Objective & Strategy |
|
| The investment seeks investment results that correspond to the investment performance of U.S. common stocks, as represented by the Russell 2000® Index.
|
|
| Under normal circumstances, the fund will invest at least 80% of its net assets in investments with economic characteristics similar to small cap stocks as represented in the index. The index is an unmanaged index comprising common stocks of approximately 2,400 smaller U.S. companies that aims to include approximately 10% of the total market capitalization of the broader Russell 3000® Index. |
|
|
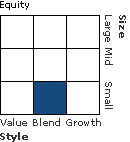
| Morningstar Category: Small Blend |
|
| Small-blend portfolios favor U.S. firms at the smaller end of the market-capitalization range. Some aim to own an array of value and growth stocks while others employ a discipline that leads to holdings with valuations and growth rates close to the small-cap averages. Stocks in the bottom 10% of the capitalization of the U.S. equity market are defined as small cap. The blend style is assigned to portfolios where neither growth nor value characteristics predominate.
|
|
|
| Small Cap Funds: Smaller companies typically have higher risk of failure, and are not as well established as larger blue-chip companies. Historically, the smaller company stocks have experienced a greater degree of market volatility than the overall market average. |
|
|
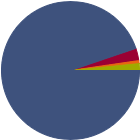
| % of Net Assets |
 |
U.S. Stocks |
94.9 |
 |
Non-U.S. Stocks |
2.9 |
 |
Bonds |
0.7 |
 |
Cash |
1.6 |
 |
Other |
0.0 |
|
|
 |
| Data through 2025-08-31 |
|
|
|
|
| Morningstar Equity Sectors |
|
|
|
% of Stocks |
 |
Cyclical |
39.67 |
 |
Basic Materials |
4.42 |
 |
Consumer Cyclical |
10.32 |
 |
Financial Services |
17.81 |
 |
Real Estate |
7.12 |
|
|
|
 |
Sensitive |
38.64 |
 |
Communication Services |
2.57 |
 |
Energy |
4.55 |
 |
Industrials |
15.73 |
 |
Technology |
15.79 |
|
|
|
 |
Defensive |
21.68 |
 |
Consumer Defensive |
3.08 |
 |
Healthcare |
15.51 |
 |
Utilities |
3.09 |
|
| Data through 2025-08-31 |
|
|
| Total Number of Stock Holdings |
1980 |
| Total Number of Bond Holdings |
1 |
| % of Net Assets in Top 10 Holdings |
8.47 |
|
|
| Turnover % |
(as of 2024-12-31) |
20.00 |
| 30 Day SEC Yield % |
0.00 |
|
|
Sector |
P/E |
% of Net
Assets
|
 |
 |
 |
 |
 |
|
iShares Russell 2000 ETF |
--- |
--- |
3.45 |
 |
Morgan Stanley Inst Lqudty Gov Sec Ins |
--- |
--- |
1.57 |
|
United States Treasury Bills 0% |
--- |
--- |
0.67 |
|
Credo Technology Group Holding Ltd |
 |
--- |
0.62 |
|
Fabrinet |
 |
39.47 |
0.41 |
 |
|
Kratos Defense & Security Solutions Inc |
 |
946.30 |
0.37 |
 |
Bloom Energy Corp Class A |
 |
789.73 |
0.37 |
|
IonQ Inc Class A |
 |
--- |
0.35 |
 |
Ensign Group Inc |
 |
31.81 |
0.33 |
|
Nextracker Inc Ordinary Shares - Class A |
 |
22.75 |
0.33 |
 |
|
 |
|
|
|
|
|
| Lending, Long-Term Outlook and Projections, Loss of Money, Not FDIC Insured, Index Correlation/Tracking Error, Market/Market Volatility, Equity Securities, ETF, Industry and Sector Investing, Restricted/Illiquid Securities, Derivatives, Shareholder Activity, Passive Management, Portfolio Diversification, Small Cap, Real Estate/REIT Sector, Money Market Fund Ownership |
|
| Show Risk Definitions |
|
|
| Inception Date: 2000-04-27 |
|
| Kevin L. Keene (2008-11-30) |
|
| Kevin L. Keene,
CFA May 2014 -present: Portfolio Manager, Ameritas Investment Partners, Inc.
April 2013-April 2014: Assistant Portfolio Manager, Ameritas Investment Partners, Inc.
2011-2013: Senior Analyst, Ameritas Investment Partners, Inc.
2008-2011: Equity Index and Derivatives Analyst, Ameritas Investment Partners, Inc. |
|
|
|
| Calvert Research and Management |
|
|
| Calvert Research and Management |
|
|
| Ameritas Investment Partners, Inc |
|
|

© Copyright 2025 Morningstar, Inc. All rights reserved. Morningstar, the Morningstar logo, Morningstar.com, Morningstar Tools are either trademark or service marks of Morningstar, Inc. The information contained herein: (1) is proprietary to Morningstar and/or its content providers; (2) may not be copied or distributed; and (3) is not warranted to be accurate, complete or timely. Neither Morningstar nor its content providers are responsible for any damages or any losses arising from any use of information. Past performance is no guarantee of future performance. |
|
Past performance is no guarantee of future results.
Returns will vary and shares may be worth more or less than their original cost when sold.
|
|


