| Fidelity VIP Contrafund Initial |
|
 |
|
| Release date as of 2025-09-30. Data on page is subject to change. |
|
|
Overall Morningstar
Rating™
|
| What is this?
|
|
 |
| As of 2025-09-30 |
|
Out of 1024
Large Growth Funds
|
|
|
|
|
|
| Total Fund Assets ($ Mil) |
| 28,306.46 |
|
|
|
| Investment Objective & Strategy |
|
| The investment seeks long-term capital appreciation.
|
|
| The fund normally invests primarily in common stocks. It invests in securities of companies whose value Fidelity Management & Research Company LLC (FMR) believes is not fully recognized by the public. The fund invests in domestic and foreign issuers. It invests in either "growth" stocks or "value" stocks or both and uses fundamental analysis of factors such as each issuer's financial condition and industry position, as well as market and economic conditions, to select investments. |
|
|
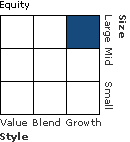
| Morningstar Category: Large Growth |
|
| Large-growth portfolios invest primarily in big U.S. companies that are projected to grow faster than other large-cap stocks. Stocks in the top 70% of the capitalization of the U.S. equity market are defined as large cap. Growth is defined based on fast growth (high growth rates for earnings, sales, book value, and cash flow) and high valuations (high price ratios and low dividend yields). Most of these portfolios focus on companies in rapidly expanding industries.
|
|
|
| There are no additional fund specific investment risks (e.g. liquidity risk, currency risk, foreign investment risk, etc.) associated with this fund beyond the normal risks generally associated with investing in a mutual fund. |
|
|
| % of Net Assets |
 |
U.S. Stocks |
89.1 |
 |
Non-U.S. Stocks |
7.5 |
 |
Bonds |
0.0 |
 |
Cash |
2.2 |
 |
Other |
1.2 |
|
|
 |
| Data through 2025-08-31 |
|
|
|
|
| Morningstar Equity Sectors |
|
|
|
% of Stocks |
 |
Cyclical |
28.69 |
 |
Basic Materials |
1.51 |
 |
Consumer Cyclical |
11.01 |
 |
Financial Services |
15.14 |
 |
Real Estate |
1.03 |
|
|
|
 |
Sensitive |
58.47 |
 |
Communication Services |
20.12 |
 |
Energy |
1.20 |
 |
Industrials |
9.45 |
 |
Technology |
27.70 |
|
|
|
 |
Defensive |
12.84 |
 |
Consumer Defensive |
2.70 |
 |
Healthcare |
8.53 |
 |
Utilities |
1.61 |
|
| Data through 2025-08-31 |
|
|
| Total Number of Stock Holdings |
356 |
| Total Number of Bond Holdings |
1 |
| % of Net Assets in Top 10 Holdings |
46.41 |
|
|
| Turnover % |
(as of 2024-12-31) |
36.00 |
| 30 Day SEC Yield % |
--- |
|
|
Sector |
P/E |
% of Net
Assets
|
 |
|
|
|
|
 |
NVIDIA Corp |
|
54.40 |
9.91 |
|
Meta Platforms Inc Class A |
|
27.23 |
9.39 |
|
Microsoft Corp |
|
38.97 |
5.72 |
|
Amazon.com Inc |
|
34.60 |
5.13 |
|
Alphabet Inc Class C |
|
28.78 |
4.71 |
 |
|
Berkshire Hathaway Inc Class B |
|
16.74 |
3.62 |
|
Netflix Inc |
|
45.72 |
2.25 |
|
Fidelity Cash Central Fund |
--- |
--- |
2.03 |
|
Eli Lilly and Co |
|
54.12 |
1.92 |
|
Amphenol Corp Class A |
|
45.30 |
1.73 |
|
|
 |
|
|
|
|
|
| Foreign Securities, Loss of Money, Not FDIC Insured, Growth Investing, Value Investing, Issuer, Market/Market Volatility, Equity Securities |
|
| Show Risk Definitions |
|
|
| Inception Date: 1995-01-03 |
|
| Matthew Drukker (2024-05-22) |
|
| Matthew Drukker is a member of FMR’s Stock Selector Large Cap Group (communication services sector). Matthew Drukker is portfolio manager of Fidelity Management & Research Company. Prior to joining Fidelity Investments in August 2007 as a research analyst, Mr. Drukker was an investment banker at Sander O'Neill in New York from 1999 to 2006. |
|
| Nidhi Gupta (2025-04-11) |
|
| Nidhi Gupta has joined Fidelity Investments in 2008 and worked as an equity research analyst and portfolio manager.
Since joining Fidelity Investments in 2007, Ms. Gupta has worked as an equity research analyst and portfolio manager.
It is expected that Ms. Gupta will transition off of the fund effective on or about December 31, 2020. |
|
| William Danoff (2018-05-01) |
|
| Mr. Danoff has worked as a research analyst and portfolio manager since joining Fidelity Investments in 1986. Prior to joining the firm, he was a research analyst for Furman Selz in New York City, covering advertising stocks and special situations. |
|
|
|
| Fidelity Management & Research Company LLC |
|
|
|
|
|
| FMR Investment Management (U.K.) Limited |
| Fidelity Management & Research (Japan) Limited |
| Fidelity Management & Research (HK) Ltd |
|
|

© Copyright 2025 Morningstar, Inc. All rights reserved. Morningstar, the Morningstar logo, Morningstar.com, Morningstar Tools are either trademark or service marks of Morningstar, Inc. The information contained herein: (1) is proprietary to Morningstar and/or its content providers; (2) may not be copied or distributed; and (3) is not warranted to be accurate, complete or timely. Neither Morningstar nor its content providers are responsible for any damages or any losses arising from any use of information. Past performance is no guarantee of future performance. |
|
Past performance is no guarantee of future results.
Returns will vary and shares may be worth more or less than their original cost when sold.
|
|