| Fidelity VIP Mid Cap Service 2 |
|
 |
|
| Release date as of 2025-09-30. Data on page is subject to change. |
|
|
Overall Morningstar
Rating™
|
| What is this?
|
|
 |
| As of 2025-09-30 |
|
Out of 373
Mid-Cap Blend Funds
|
|
|
|
|
|
| Total Fund Assets ($ Mil) |
| 7,657.05 |
|
|
|
| Investment Objective & Strategy |
|
| The investment seeks long-term growth of capital.
|
|
| The fund normally invests at least 80% of assets in securities of companies with medium market capitalizations. The adviser generally defines medium market capitalization companies as those whose market capitalization is similar to the market capitalization of companies in the Russell Midcap ® Index or the S&P MidCap 400 ® Index. |
|
|
| Morningstar Category: Mid-Cap Blend |
|
| The typical mid-cap blend portfolio invests in U.S. stocks of various sizes and styles, giving it a middle-of the-road profile. Most shy away from high-priced growth stocks but aren't so price-conscious that they land in value territory. Stocks in the middle 20% of the capitalization of the U.S. equity market are defined as mid-cap. The blend style is assigned to portfolios where neither growth nor value characteristics predominate.
|
|
|
| Mid Cap Funds: The securities of companies with market capitalizations below $10 billion may be more volatile and less liquid than the securities of larger companies. |
|
|
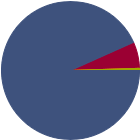
| % of Net Assets |
 |
U.S. Stocks |
93.4 |
 |
Non-U.S. Stocks |
6.2 |
 |
Bonds |
0.0 |
 |
Cash |
0.5 |
 |
Other |
0.0 |
|
|
 |
| Data through 2025-08-31 |
|
|
|
|
| Morningstar Equity Sectors |
|
|
|
% of Stocks |
 |
Cyclical |
41.13 |
 |
Basic Materials |
3.94 |
 |
Consumer Cyclical |
12.08 |
 |
Financial Services |
19.23 |
 |
Real Estate |
5.88 |
|
|
|
 |
Sensitive |
36.94 |
 |
Communication Services |
1.67 |
 |
Energy |
3.22 |
 |
Industrials |
19.48 |
 |
Technology |
12.57 |
|
|
|
 |
Defensive |
21.96 |
 |
Consumer Defensive |
5.98 |
 |
Healthcare |
12.34 |
 |
Utilities |
3.64 |
|
| Data through 2025-08-31 |
|
|
| Total Number of Stock Holdings |
181 |
| Total Number of Bond Holdings |
0 |
| % of Net Assets in Top 10 Holdings |
14.08 |
|
|
| Turnover % |
(as of 2024-12-31) |
52.00 |
| 30 Day SEC Yield % |
--- |
|
|
Sector |
P/E |
% of Net
Assets
|
 |
|
|
|
|
 |
Comfort Systems USA Inc |
|
43.50 |
1.67 |
|
EMCOR Group Inc |
|
28.13 |
1.64 |
|
ITT Inc |
|
26.97 |
1.52 |
|
RB Global Inc |
|
--- |
1.45 |
|
East West Bancorp Inc |
|
11.82 |
1.43 |
 |
|
Equitable Holdings Inc |
|
41.08 |
1.35 |
|
Reinsurance Group of America Inc |
|
16.91 |
1.31 |
|
Somnigroup International Inc |
|
58.25 |
1.25 |
|
Wintrust Financial Corp |
|
12.14 |
1.23 |
|
US Foods Holding Corp |
|
32.26 |
1.23 |
|
|
 |
|
|
|
|
|
| Foreign Securities, Loss of Money, Not FDIC Insured, Growth Investing, Value Investing, Issuer, Market/Market Volatility, Equity Securities, Mid-Cap |
|
| Show Risk Definitions |
|
|
| Inception Date: 2000-01-12 |
|
| Maurice FitzMaurice (2024-08-14) |
|
| Since joining Fidelity Investments in 1998, Mr. Fitzmaurice has worked as research analyst and portfolio manager. |
|
| Thomas Allen (2001-06-13) |
|
| He most recently worked for Stewart Investors in London. Tom joined the predecessor business of Stewart Investors in 2012. He initially worked in Singapore, before moving to Edinburgh to work on Asia Pacific strategies. From 2015, Tom was part of the Stewart Investors team in London. He co-managed Asia Pacific and Emerging Markets strategies with Ashish Swarup from 2017. He has a degree in History from University College London (UCL). |
|
|
|
| Fidelity Management & Research Company LLC |
|
|
|
|
|
| FMR Investment Management (U.K.) Limited |
| Fidelity Management & Research (Japan) Limited |
| Fidelity Management & Research (HK) Ltd |
|
|

© Copyright 2025 Morningstar, Inc. All rights reserved. Morningstar, the Morningstar logo, Morningstar.com, Morningstar Tools are either trademark or service marks of Morningstar, Inc. The information contained herein: (1) is proprietary to Morningstar and/or its content providers; (2) may not be copied or distributed; and (3) is not warranted to be accurate, complete or timely. Neither Morningstar nor its content providers are responsible for any damages or any losses arising from any use of information. Past performance is no guarantee of future performance. |
|
Past performance is no guarantee of future results.
Returns will vary and shares may be worth more or less than their original cost when sold.
|
|