| LVIP JPMorgan Mid Cap Value Standard |
|
 |
|
| Release date as of 2025-09-30. Data on page is subject to change. |
|
|
Overall Morningstar
Rating™
|
| What is this?
|
|
 |
| As of 2025-09-30 |
|
Out of 378
Mid-Cap Value Funds
|
|
|
|
|
|
| Total Fund Assets ($ Mil) |
| 299.29 |
|
|
|
| Investment Objective & Strategy |
|
| The investment seeks capital appreciation with the secondary goal of achieving current income by investing primarily in equity securities.
|
|
| At least 80% of the Portfolio's assets will be invested in equity securities of mid cap companies. Mid cap companies are companies with market capitalizations equal to those within the universe of the Russell Midcap Value Index and/or between $1 billion and $20 billion at the time of purchase. In implementing its main strategies, the Portfolio's investments are primarily in common stocks and real estate investment trusts (REITs). |
|
|
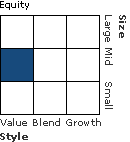
| Morningstar Category: Mid-Cap Value |
|
| Some mid-cap value portfolios focus on medium-size companies while others land here because they own a mix of small-, mid-, and large-cap stocks. All look for U.S. stocks that are less expensive or growing more slowly than the market. Stocks in the middle 20% of the capitalization of the U.S. equity market are defined as mid-cap. Value is defined based on low valuations (low price ratios and high dividend yields) and slow growth (low growth rates for earnings, sales, book value, and cash flow).
|
|
|
| Mid Cap Funds: The securities of companies with market capitalizations below $10 billion may be more volatile and less liquid than the securities of larger companies. |
|
|
| % of Net Assets |
 |
U.S. Stocks |
98.0 |
 |
Non-U.S. Stocks |
0.0 |
 |
Bonds |
0.0 |
 |
Cash |
2.1 |
 |
Other |
0.0 |
|
|
 |
| Data through 2025-06-30 |
|
|
|
|
| Morningstar Equity Sectors |
|
|
|
% of Stocks |
 |
Cyclical |
43.59 |
 |
Basic Materials |
2.79 |
 |
Consumer Cyclical |
12.27 |
 |
Financial Services |
19.24 |
 |
Real Estate |
9.29 |
|
|
|
 |
Sensitive |
34.72 |
 |
Communication Services |
2.14 |
 |
Energy |
6.31 |
 |
Industrials |
15.13 |
 |
Technology |
11.14 |
|
|
|
 |
Defensive |
21.68 |
 |
Consumer Defensive |
5.68 |
 |
Healthcare |
8.84 |
 |
Utilities |
7.16 |
|
| Data through 2025-06-30 |
|
|
| Total Number of Stock Holdings |
96 |
| Total Number of Bond Holdings |
0 |
| % of Net Assets in Top 10 Holdings |
17.70 |
|
|
| Turnover % |
(as of 2024-12-31) |
35.00 |
| 30 Day SEC Yield % |
--- |
|
|
Sector |
P/E |
% of Net
Assets
|
 |
 |
 |
 |
 |
 |
State Street Instl US Govt MMkt Premier |
--- |
--- |
2.05 |
 |
Fidelity National Information Services Inc |
 |
261.08 |
1.99 |
 |
WEC Energy Group Inc |
 |
22.53 |
1.92 |
 |
Loews Corp |
 |
15.87 |
1.92 |
 |
State Street Corp |
 |
12.02 |
1.69 |
 |
 |
Ameriprise Financial Inc |
 |
14.75 |
1.67 |
 |
The Hartford Insurance Group Inc |
 |
11.33 |
1.65 |
 |
Arch Capital Group Ltd |
 |
9.09 |
1.61 |
 |
Raymond James Financial Inc |
 |
16.12 |
1.61 |
 |
Quest Diagnostics Inc |
 |
21.26 |
1.59 |
 |
|
 |
|
|
|
|
|
| Loss of Money, Not FDIC Insured, Value Investing, Active Management, Market/Market Volatility, Industry and Sector Investing, Restricted/Illiquid Securities, Derivatives, Socially Conscious, Shareholder Activity, Mid-Cap, Real Estate/REIT Sector |
|
| Show Risk Definitions |
|
|
| Inception Date: 2001-09-28 |
|
| Jonathan K.L. Simon (2001-09-28) |
|
| Jonathan K.L. Simon, managing director, is a portfolio manager in the U.S. Equity Group. An employee since 1980, and a member of U.S. Equity Value Group. In addition, he joined the firm as an analyst in the London office, transferred to New York in 1983 and became a portfolio manager in 1987. Jonathan has held numerous key positions in the firm, including president of Robert Fleming's U.S. asset management. |
|
| Lawrence E. Playford (2004-12-31) |
|
| Lawrence Playford is Chief investment officer of the U.S. equity value group since 2016 and portfolio manager of JPMorgan’s U.S. equity value group since 2004. He began his investment career in 1993 and has a BBA from the University of Notre Dame and an MBA from Fordham University. |
|
|
|
| Lincoln Financial Investments Corporation |
|
|
|
|
|
| J.P. Morgan Investment Management, Inc. |
|
|

© Copyright 2025 Morningstar, Inc. All rights reserved. Morningstar, the Morningstar logo, Morningstar.com, Morningstar Tools are either trademark or service marks of Morningstar, Inc. The information contained herein: (1) is proprietary to Morningstar and/or its content providers; (2) may not be copied or distributed; and (3) is not warranted to be accurate, complete or timely. Neither Morningstar nor its content providers are responsible for any damages or any losses arising from any use of information. Past performance is no guarantee of future performance. |
|
Past performance is no guarantee of future results.
Returns will vary and shares may be worth more or less than their original cost when sold.
|
|


