| T. Rowe Price Health Sciences Port |
|
 |
|
| Release date as of 2025-09-30. Data on page is subject to change. |
|
|
Overall Morningstar
Rating™
|
| What is this?
|
|
 |
| As of 2025-09-30 |
|
Out of 165
Health Funds
|
|
|
|
|
|
| Total Fund Assets ($ Mil) |
| 644.38 |
|
|
|
| Investment Objective & Strategy |
|
| The investment seeks long-term capital appreciation.
|
|
| The fund will normally invest at least 80% of its net assets (including any borrowings for investment purposes) in the common stocks of companies engaged in the research, development, production, or distribution of products or services related to health care, medicine, or the life sciences (collectively termed "health sciences"). |
|
|
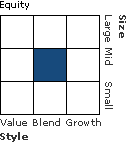
| Morningstar Category: Health |
|
| Health portfolios focus on the medical and health-care industries. Most invest in a range of companies, buying everything from pharmaceutical and medical-device makers to HMOs, hospitals, and nursing homes. A few portfolios concentrate on just one industry segment, such as service providers or biotechnology firms.
|
|
|
| Sector Funds: Funds that invest exclusively in one sector or industry involve risks due to the lack of industry diversification and expose the investor to increased industry-specific risks. |
|
|
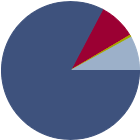
| % of Net Assets |
 |
U.S. Stocks |
82.8 |
 |
Non-U.S. Stocks |
8.8 |
 |
Bonds |
0.0 |
 |
Cash |
0.5 |
 |
Other |
8.0 |
|
|
 |
| Data through 2025-09-30 |
|
|
|
|
| Morningstar Equity Sectors |
|
|
|
% of Stocks |
 |
Cyclical |
0.00 |
 |
Basic Materials |
0.00 |
 |
Consumer Cyclical |
0.00 |
 |
Financial Services |
0.00 |
 |
Real Estate |
0.00 |
|
|
|
 |
Sensitive |
0.00 |
 |
Communication Services |
0.00 |
 |
Energy |
0.00 |
 |
Industrials |
0.00 |
 |
Technology |
0.00 |
|
|
|
 |
Defensive |
100.00 |
 |
Consumer Defensive |
0.00 |
 |
Healthcare |
100.00 |
 |
Utilities |
0.00 |
|
| Data through 2025-09-30 |
|
|
| Total Number of Stock Holdings |
128 |
| Total Number of Bond Holdings |
0 |
| % of Net Assets in Top 10 Holdings |
48.25 |
|
|
| Turnover % |
(as of 2024-12-31) |
49.90 |
| 30 Day SEC Yield % |
0.00 |
|
|
Sector |
P/E |
% of Net
Assets
|
 |
 |
 |
 |
 |
 |
Eli Lilly and Co |
 |
41.38 |
8.71 |
 |
Aggregate Miscellaneous Equity |
--- |
--- |
7.90 |
 |
Intuitive Surgical Inc |
 |
70.11 |
4.75 |
 |
argenx SE ADR |
 |
35.03 |
4.68 |
 |
Stryker Corp |
 |
48.87 |
4.58 |
 |
 |
UnitedHealth Group Inc |
 |
17.97 |
4.11 |
 |
Thermo Fisher Scientific Inc |
 |
32.13 |
3.76 |
 |
AbbVie Inc |
 |
108.67 |
3.38 |
 |
Alnylam Pharmaceuticals Inc |
 |
1498.53 |
3.27 |
 |
Insmed Inc |
 |
--- |
3.11 |
 |
|
 |
|
|
|
|
|
| Foreign Securities, Loss of Money, Not FDIC Insured, Active Management, Market/Market Volatility, Equity Securities, Industry and Sector Investing, IPO, Other, Restricted/Illiquid Securities, Management, Mid-Cap, Large Cap |
|
| Show Risk Definitions |
|
|
| Inception Date: 2000-12-29 |
|
| Ziad Bakri (2016-04-01) |
|
| Ziad Bakri joined T. Rowe Price in 2011 and has since been a key member of the healthcare research team, influencing investment decisions and making significant contributions to the stock selections. Ziad has had a long track record of analyzing biotechnology companies, a key sector within the healthcare industry. Ziad brings a unique perspective to his new role, having been a medical doctor and an emergency medicine resident at the Royal London Hospital before beginning his investment career. Prior to joining T. Rowe Price, Ziad held biotechnology equity research and healthcare investment ban |
|
|
|
| T. Rowe Price Associates, Inc. |
|
|
|
|
|
|
|
|

© Copyright 2025 Morningstar, Inc. All rights reserved. Morningstar, the Morningstar logo, Morningstar.com, Morningstar Tools are either trademark or service marks of Morningstar, Inc. The information contained herein: (1) is proprietary to Morningstar and/or its content providers; (2) may not be copied or distributed; and (3) is not warranted to be accurate, complete or timely. Neither Morningstar nor its content providers are responsible for any damages or any losses arising from any use of information. Past performance is no guarantee of future performance. |
|
Past performance is no guarantee of future results.
Returns will vary and shares may be worth more or less than their original cost when sold.
|
|


