| Principal SAM Balanced R4 PSBLX |
|
 |
|
| Release date as of 2024-09-30. Data on page is subject to change. |
|
|
Overall Morningstar
Rating™
|
| What is this?
|
|
 |
| As of 2024-09-30 |
|
Out of 682
Moderate Allocation Funds
|
|
|
|
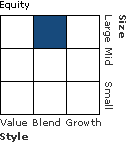
Morningstar®
Style Box™
|
| What is this?
|
|
 |
|
| As of 2024-09-30 |
|
 |
|
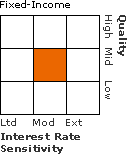
| As of 2024-08-31 |
|
|
| Total Fund Assets ($ Mil) |
| 4,724.18 |
|
|
|
| Investment Objective & Strategy |
|
| The investment seeks to provide as high a level of total return (consisting of reinvested income and capital appreciation) as is consistent with reasonable risk.
|
|
| The fund operates as funds of funds and generally invests: between 20% and 60% of its assets in fixed-income funds, and less than 40% in any one fixed-income fund; between 40% and 80% of its assets in equity funds, and less than 30% in any one equity fund; and less than 20% of its assets in specialty funds, and less than 20% in any one specialty fund. |
|
|
| Morningstar Category: Moderate Allocation |
|
| Funds in allocation categories seek to provide both income and capital appreciation by primarily investing in multiple asset classes, including stocks, bonds, and cash. These moderate strategies seek to balance preservation of capital with appreciation. They typically expect volatility similar to a strategic equity exposure between 50% and 70%.
|
|
|
| Growth of $10,000 |
|
(from 2014-01-01
to 2024-09-30)
|
|
|
|
|
 |
Investment: |
Principal SAM Balanced R4 |
 |
Benchmark 1: |
Morningstar Mod Tgt Risk TR USD |
 |
Benchmark 2: |
Morningstar Mod Tgt Risk TR USD |
 |
Category: |
Moderate Allocation |
|
|
This graph presents historical performance for the investment as well as an index and/or peer group. If the investment, index and/or peer group have performed similarly, the line representing the fund will overlay the index and/or peer group. Therefore, the line(s) representing the index and/or peer group history may be hidden.
|
|
|
| Total Annualized Returns % |
|
|
YTD |
1 Year |
3 Year |
5 Year |
10 Year |
Since Inception |
| Investment |
13.23 |
24.40 |
4.54 |
7.53 |
6.65 |
6.17 |
| Morningstar Mod Tgt Risk TR USD |
11.45 |
22.04 |
3.61 |
7.07 |
6.49 |
--- |
| Morningstar Mod Tgt Risk TR USD |
11.45 |
22.04 |
3.61 |
7.07 |
6.49 |
--- |
| Category |
12.27 |
21.99 |
4.89 |
8.01 |
6.89 |
6.50 |
|
|
|
| Morningstar Rating |
--- |
--- |
 |
 |
 |
--- |
|
|
# of compared
Moderate Allocation
funds covered
(3 yrs : out of
682
funds)
(5 yrs : out of
643
funds)
(10 yrs : out of
491
funds)
|
|
|
|
| Ratings reflect risk-adjusted performance and are derived from a weighted average of the performance figures associated with its three, five and ten-year (if applicable) time periods. |
|
|
|
|
|
| Investment results shown represent historical performance and do not guarantee future results. Investment returns and principal values fluctuate with changes in interest rates and other market conditions so the value, when redeemed may be worth more or less than original costs. Current performance may be lower or higher than the performance data shown. |
|
|
|
Total Annual Operating Expense
|
1.16%
|
| Prospectus Net Expense Ratio |
1.16%
|
| Maximum Sales Charge |
--- |
|
| The total annual operating expense shown is before management fee waivers or expense caps. For more information on waivers/reimbursements, please see the prospectus. The total annual operating expense is also referred to as the prospectus gross expense ratio. |
|
|
Type |
Date |
% |
| --- |
--- |
--- |
--- |
|
|
| % of Net Assets |
 |
U.S. Stocks |
50.5 |
 |
Non-U.S. Stocks |
12.6 |
 |
Bonds |
32.1 |
 |
Cash |
3.3 |
 |
Other |
1.6 |
|
|
 |
| Data through 2024-09-30 |
|
|
|
|
| Morningstar Equity Sectors |
|
|
|
% of Stocks |
 |
Cyclical |
37.16 |
 |
Basic Materials |
3.31 |
 |
Consumer Cyclical |
10.36 |
 |
Financial Services |
18.26 |
 |
Real Estate |
5.23 |
|
|
|
 |
Sensitive |
42.21 |
 |
Communication Services |
7.56 |
 |
Energy |
4.40 |
 |
Industrials |
10.01 |
 |
Technology |
20.24 |
|
|
|
 |
Defensive |
20.63 |
 |
Consumer Defensive |
5.69 |
 |
Healthcare |
11.70 |
 |
Utilities |
3.24 |
|
| Data through 2024-09-30 |
|
|
|
| Morningstar Fixed-Income Sectors |
|
| % Fund |
 |
Government |
29.24 |
 |
Corporate |
39.87 |
 |
Securitized |
21.75 |
 |
Municipal |
0.02 |
 |
Cash & Equivalents |
6.67 |
 |
Derivative |
2.46 |
|
|
|
% Bonds |
| AAA |
51.22 |
| AA |
1.78 |
| A |
13.23 |
| BBB |
19.17 |
| BB |
7.07 |
| B |
4.33 |
| Below B |
1.85 |
| Not Rated |
1.35 |
|
|
|
|
|
| Total Number of Stock Holdings |
0 |
| Total Number of Bond Holdings |
0 |
| % of Net Assets in Top 10 Holdings |
72.58 |
|
|
| Turnover % |
(as of 2023-10-31) |
26.10 |
| 30 Day SEC Yield % |
1.54 |
|
|
Sector |
Country |
Maturity Date |
Market Value ($000) |
% of Net Assets |
|
| Principal Core Fixed Income R6 |
--- |
USA |
--- |
776,623 |
16.44 |
| Principal US Mega-Cap ETF |
--- |
USA |
--- |
551,735 |
11.68 |
| Principal Capital Appreciation Inst |
--- |
USA |
--- |
440,244 |
9.32 |
| Principal Blue Chip R6 |
--- |
USA |
--- |
363,577 |
7.70 |
| Principal Equity Income Inst |
--- |
USA |
--- |
347,323 |
7.35 |
 |
| Principal Large Cap Value III Inst |
--- |
USA |
--- |
262,540 |
5.56 |
| Principal Bond Market Index Instl |
--- |
USA |
--- |
203,506 |
4.31 |
| Principal Diversified International R6 |
--- |
USA |
--- |
166,480 |
3.52 |
| Principal LargeCap Growth I R6 |
--- |
USA |
--- |
159,816 |
3.38 |
| Principal Overseas Instl |
--- |
USA |
--- |
156,985 |
3.32 |
 |
|
 |
|
|
|
|
|
| Currency, Emerging Markets, Foreign Securities, Loss of Money, Not FDIC Insured, Equity Securities, Fixed-Income Securities, Maturity/Duration, Shareholder Activity, Conflict of Interest, Structured Products |
|
| Show Risk Definitions |
|
|
| Inception Date: 2007-01-16 |
|
| Todd A. Jablonski (2010-01-01) |
|
| Todd Jablonski is the chief investment officer and head of multi-asset investment strategies and solutions for Principal Global Investors. He is responsible for the business, research, and investment management of Principal Global Asset Allocation. Jablonski oversees specialized multi-asset investment strategies and solutions, including target date, dynamic risk, outcome-oriented solutions, and bespoke multi-asset investments on behalf of global clients. He leads portfolio management, product development, and research capabilities, which include macro insights, manager research, and investment risk & analytics. He also serves as a Portfolio Manager on U.S. dynamic risk asset allocation strategies. In addition, Jablonski is a member of Principal Global Investors’ Operating Committee. In this capacity, he contributes to the overall vision and management of Principal Global Investors, including strategic planning and execution. He also serves on the board of directors of AFP Cuprum S.A. in Santiago, Chile. Jablonski joined Principal® in 2010. Previously, he was an Executive Director and Portfolio Manager at UBS, and prior to that, a Vice President and Portfolio Manager at Credit Suisse. He has an MBA with concentration in quantitative finance from New York University, a bachelor’s degree in economics from the University of Virginia and has earned the right to use the Chartered Financial Analyst designation. |
|
| Yesim Tokat-Acikel (2023-01-03) |
|
| Yesim Tokat-Acikel, PhD, is a Portfolio Manager for QMA and a member of the Global Portfolio Solutions team. Her responsibilities include research and portfolio management with a focus on Global Tactical Asset Allocation. Prior to joining QMA, Yesim was a senior quantitative analyst at AllianceBernstein, where she developed Global Tactical Asset Allocation strategies. She developed global equity, REIT, and credit models, as well as dynamic risk models. Previously, she was a senior investment analyst for The Vanguard Group where she built tactical and strategic asset allocation models for the retirement and private client markets. Yesim has published papers on strategic and tactical portfolio allocation issues in the Journal of Investing, Journal of Wealth Management, Journal of Financial Planning, Journal of Economic Dynamics and Control, and Strategic Management Journal. She earned a BS in Industrial Engineering from Bilkent University in Turkey; an MS in Industrial Engineering from the University of Arizona, Tucson, and a PhD in Economics from the University of California, Santa Barbara. |
|
| Brody Dass (2022-01-01) |
|
| Brody is a Portfolio Manager at Principal Global Asset Allocation, an investment boutique within Principal Global Investors that engages in the creation of asset allocation solutions. He is responsible for co-managing our dynamic risk asset allocation suite and our dynamic risk model portfolios, including a digital advisor solution. He joined Principal in 2015. Previously, he was a Taxable Fixed Income Analyst at Nuveen Asset Management. Brody received a bachelor’s degree in Finance from the University of Iowa. He has earned the right to use the Chartered Financial Analyst designation. |
|
|
|
| Principal Global Investors LLC |
|
|
|
|
|

© Copyright 2024 Morningstar, Inc. All rights reserved. Morningstar, the Morningstar logo, Morningstar.com, Morningstar Tools are either trademark or service marks of Morningstar, Inc. The information contained herein: (1) is proprietary to Morningstar and/or its content providers; (2) may not be copied or distributed; and (3) is not warranted to be accurate, complete or timely. Neither Morningstar nor its content providers are responsible for any damages or any losses arising from any use of information. Past performance is no guarantee of future performance. |
|
Past performance is no guarantee of future results.
Returns will vary and shares may be worth more or less than their original cost when sold.
|
|


