| Royce Premier Invmt RYPRX |
|
 |
|
| Release date as of 2024-04-30. Data on page is subject to change. |
|
|
Overall Morningstar
Rating™
|
| What is this?
|
|
 |
| As of 2024-04-30 |
|
Out of 583
Small Blend Funds
|
|
|
|
|
|
| Total Fund Assets ($ Mil) |
| 1,376.85 |
|
|
|
| Investment Objective & Strategy |
|
| The investment seeks long-term growth of capital.
|
|
| The fund's investment adviser invests the fund's assets in a limited number (generally less than 100) of equity securities of primarily small-cap companies at the time of investment. Normally, the fund invests at least 80% of its net assets in equity securities of such premier companies. At least 65% of these securities will be issued by small-cap companies at the time of investment. |
|
|
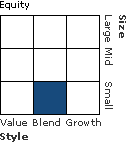
| Morningstar Category: Small Blend |
|
| Small-blend portfolios favor U.S. firms at the smaller end of the market-capitalization range. Some aim to own an array of value and growth stocks while others employ a discipline that leads to holdings with valuations and growth rates close to the small-cap averages. Stocks in the bottom 10% of the capitalization of the U.S. equity market are defined as small cap. The blend style is assigned to portfolios where neither growth nor value characteristics predominate.
|
|
|
| Growth of $10,000 |
|
(from 2014-01-01
to 2024-04-30)
|
|
|
|
|
 |
Investment: |
Royce Premier Invmt |
 |
Benchmark 1: |
S&P 500 TR USD |
 |
Benchmark 2: |
Russell 2000 TR USD |
 |
Category: |
Small Blend |
|
|
This graph presents historical performance for the investment as well as an index and/or peer group. If the investment, index and/or peer group have performed similarly, the line representing the fund will overlay the index and/or peer group. Therefore, the line(s) representing the index and/or peer group history may be hidden.
|
|
|
| Total Annualized Returns % |
|
|
YTD |
1 Year |
3 Year |
5 Year |
10 Year |
Since Inception |
| Investment |
-2.69 |
10.65 |
1.35 |
7.34 |
7.66 |
11.03 |
| S&P 500 TR USD |
6.04 |
22.66 |
8.06 |
13.19 |
12.41 |
10.16 |
| Russell 2000 TR USD |
-2.22 |
13.32 |
-3.18 |
5.83 |
7.22 |
8.99 |
| Category |
-0.79 |
13.98 |
0.25 |
7.17 |
7.28 |
9.41 |
|
|
|
| Morningstar Rating |
--- |
--- |
 |
|
 |
--- |
|
|
# of compared
Small Blend
funds covered
(3 yrs : out of
583
funds)
(5 yrs : out of
551
funds)
(10 yrs : out of
390
funds)
|
|
|
|
| Ratings reflect risk-adjusted performance and are derived from a weighted average of the performance figures associated with its three, five and ten-year (if applicable) time periods. |
|
|
|
|
|
| Investment results shown represent historical performance and do not guarantee future results. Investment returns and principal values fluctuate with changes in interest rates and other market conditions so the value, when redeemed may be worth more or less than original costs. Current performance may be lower or higher than the performance data shown. |
|
|
|
Total Annual Operating Expense
|
1.19%
|
| Prospectus Net Expense Ratio |
1.19%
|
| Maximum Sales Charge |
--- |
|
| The total annual operating expense shown is before management fee waivers or expense caps. For more information on waivers/reimbursements, please see the prospectus. The total annual operating expense is also referred to as the prospectus gross expense ratio. |
|
|
Type |
Date |
% |
| --- |
--- |
--- |
--- |
|
|
| % of Net Assets |
 |
U.S. Stocks |
83.1 |
 |
Non-U.S. Stocks |
11.4 |
 |
Bonds |
0.0 |
 |
Cash |
5.5 |
 |
Other |
0.0 |
|
|
 |
| Data through 2024-03-31 |
|
|
|
|
| Morningstar Equity Sectors |
|
|
|
% of Stocks |
 |
Cyclical |
41.63 |
 |
Basic Materials |
15.10 |
 |
Consumer Cyclical |
8.11 |
 |
Financial Services |
10.87 |
 |
Real Estate |
7.55 |
|
|
|
 |
Sensitive |
52.43 |
 |
Communication Services |
1.69 |
 |
Energy |
1.75 |
 |
Industrials |
34.57 |
 |
Technology |
14.42 |
|
|
|
 |
Defensive |
5.92 |
 |
Consumer Defensive |
1.75 |
 |
Healthcare |
4.17 |
 |
Utilities |
0.00 |
|
| Data through 2024-03-31 |
|
|
| Total Number of Stock Holdings |
50 |
| Total Number of Bond Holdings |
0 |
| % of Net Assets in Top 10 Holdings |
28.83 |
|
|
| Turnover % |
(as of 2023-12-31) |
15.00 |
| 30 Day SEC Yield % |
--- |
|
|
Sector |
P/E |
% of Net
Assets
|
 |
|
|
|
|
 |
MKS Instruments Inc |
|
--- |
3.28 |
|
Lincoln Electric Holdings Inc |
|
23.30 |
3.13 |
|
SEI Investments Co |
|
18.02 |
2.94 |
|
Innospec Inc |
|
21.58 |
2.94 |
|
Reliance Inc |
|
13.28 |
2.90 |
 |
|
Kadant Inc |
|
28.52 |
2.90 |
|
Morningstar Inc |
|
56.99 |
2.78 |
|
Arcosa Inc |
|
23.32 |
2.75 |
|
FirstService Corp Ordinary Shares |
|
--- |
2.64 |
|
Quaker Houghton |
|
29.80 |
2.57 |
|
|
 |
|
|
|
|
|
| Foreign Securities, Loss of Money, Not FDIC Insured, Market/Market Volatility, Equity Securities, Industry and Sector Investing, Other, Small Cap |
|
| Show Risk Definitions |
|
|
| Inception Date: 1991-12-31 |
|
| Steven G. McBoyle (2014-11-10) |
|
| Steven G. McBoyle joined the firm in 2007. Previously, he was a Partner at Lord, Abbett & Co. LLC (2001-2007) where he was a Portfolio Manager of the Small Cap Value Fund and Small-Mid Value Fund. Prior to that he was Vice President of Mergers & Acquisitions at Morgan Stanley (2000-2001) and an Associate of Mergers & Acquisitions at Salomon Brothers (1997-2000). He began his career in public accounting within the Accounting & Audit Services Group of Deloitte & Touche (1990-1995).
Mr. McBoyle holds a bachelor's degree from the School of Accountancy at the University of Waterloo, Canada and a Master of Business Administration from Columbia University. He is also a Chartered Accountant with a degree from the Institute of Chartered Accountants in Canada and a Certified Public Accountant. |
|
| Lauren Romeo (2006-05-01) |
|
| Lauren A. Romeo, CFA, is a Portfolio Manager and Principal for Royce & Associates, LP, investment adviser to The Royce Funds. Ms. Romeo manages Royce Small-Cap Leaders Fund. She also serves as Portfolio Manager for Royce Premier Fund and Royce Pennsylvania Mutual Fund (both with Chuck Royce as Lead Portfolio Manager). She serves as an Assistant Portfolio Manager for Royce Value Trust, a closed-end fund. She has 25 years of investment industry experience.
Ms. Romeo joined Royce & Associates in 2004. Previously, she was a Portfolio Manager at Dalton Greiner, Hartman & Maher (since 2001), an A |
|
| Charles M. Royce (1991-12-31) |
|
| Royce is the Royce & Associates, LLC's President, Co-Chief Investment Officer and Portfolio Manager. Founded Royce in 1972. |
|
| Andrew S. Palen (2022-02-07) |
|
| Andrew S. Palen
Portfolio Manager
Employed by Royce since 2015
Assistant Portfolio Manager for:
Royce Pennsylvania Mutual Fund
Previously a Senior Analyst at Armistice Capital (2013-2015), a Summer Associate at UBS Global Management (2012), and an Associate at Comvest Partners (2008-2011). |
|
|
|
|
|
|
| Franklin Templeton Investments |
|
|

© Copyright 2024 Morningstar, Inc. All rights reserved. Morningstar, the Morningstar logo, Morningstar.com, Morningstar Tools are either trademark or service marks of Morningstar, Inc. The information contained herein: (1) is proprietary to Morningstar and/or its content providers; (2) may not be copied or distributed; and (3) is not warranted to be accurate, complete or timely. Neither Morningstar nor its content providers are responsible for any damages or any losses arising from any use of information. Past performance is no guarantee of future performance. |
|
Past performance is no guarantee of future results.
Returns will vary and shares may be worth more or less than their original cost when sold.
|
|